After a lengthy period of deliberation, the Rakuten Eagles officially posted Masahiro Tanaka on Christmas day. MLB teams have until Friday at 2PM PST to sign the Japanese starter. It is expected that the Dodgers will be among Tanaka’s top suitors, due to their large checkbook and Josh Beckett‘s questionable future. The Yankees, Diamondbacks, Mariners, Cubs, White Sox, and other teams are also involved. Tanaka will likely command a very high price tag due to his age (25 in November, younger than most free agents to hit the free market) and since signing him does not require a draft pick.
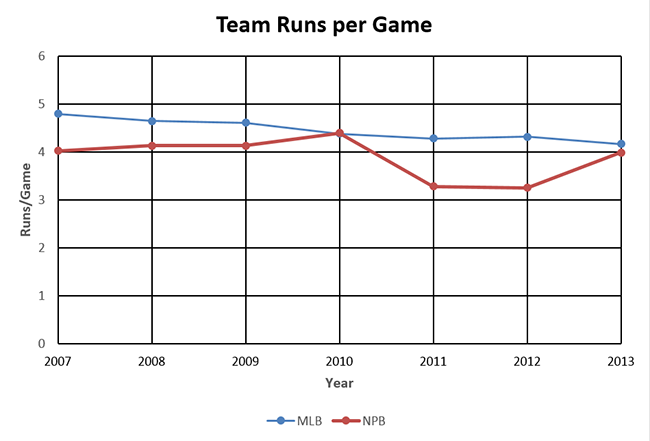
Tanaka’s ERA in Japan is a stat that really sticks out; 1.44 over the last three seasons. It’s the first thing to come up in stories about him. However, the run environment in Japan is different than it is in the US, so ERAs between countries are not directly comparable. Recent changes to the ball and the different type of play in Japan has lead to large run environment fluctuations as well:
Even here, ERA doesn’t mean much without including the run environment and the impact of the pitcher’s home ballpark. We also have not heard much about Tanaka’s peripheral numbers (FIP, etc).
In order to see how Tanaka’s numbers compare to the rest of NPB, we’ll need to use league and park adjusted statistics. ERA- compares a player’s ERA to their league average and includes the impact of their park*. Given the park factor information found in the footnotes, Tanaka’s ERA- can be found. Since Tanaka’s peripherals can be found on baseball reference, his FIP** and FIP- can be calculated as well. The point of this exercise is not to scout the stat line, but to contextualize Tanaka’s dominance in Japan.
Here is a summary of these calculations:
| Year | IP | ERA | ERA- | FIP | FIP- |
| 2007 | 186.1 | 3.82 | 107 | 3.21 | 89 |
| 2008 | 172.2 | 3.49 | 88 | 2.82 | 71 |
| 2009 | 189.2 | 2.33 | 57 | 2.81 | 69 |
| 2010 | 155 | 2.50 | 62 | 3.02 | 75 |
| 2011 | 226.1 | 1.27 | 42 | 1.50 | 50 |
| 2012 | 173 | 1.87 | 61 | 1.28 | 41 |
| 2013 | 212 | 1.27 | 35 | 1.98 | 54 |
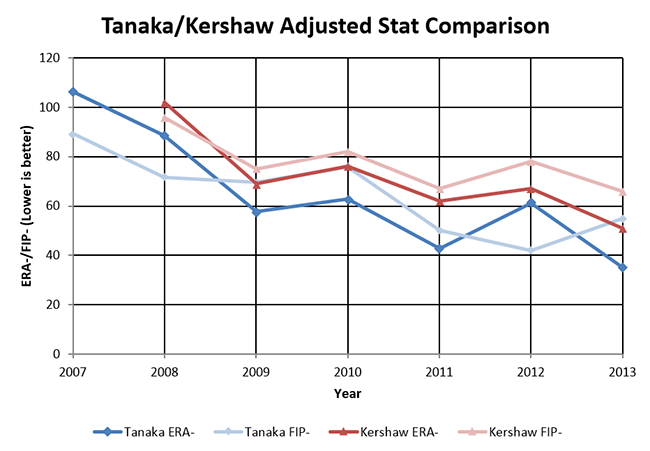
Now that we have these statistics, what do they actually mean? To find out, let’s compare Tanaka to somebody familiar. Clayton Kershaw is the best pitcher in MLB right now, is about the same age as Tanaka, and has been active over the same period. He also just posted the best ERA- by any Dodger starter since the end of the dead-ball era. Here’s a comparison of their adjusted statistics (lower is better):
Kershaw’s numbers are in red and Tanaka’s are in blue. Tanaka’s adjusted numbers are significantly better in relation to his league average than Kershaw’s over the same period. It’s somewhat interesting that Kershaw and Tanaka have had very similar year-to-year patterns on their ERA- numbers, but it probably isn’t meaningful.
So, how do Tanaka’s best seasons (41 FIP- in 2012, 35 ERA- in 2013) compare to the best MLB seasons of all time? In the US, a full season for a starter with a FIP- of 41 would be the second best season since the end of the dead-ball era; slightly better than Randy Johnson‘s 45 FIP- in 1995 but well behind the record 30 FIP- posted by Pedro Martinez (who else?) in 1999.
Tanaka’s ERA- values have been even more impressive. His 42 ERA- in 2011 would be sixth-best in major league history (ahead of Dwight Gooden in 1985, behind Pedro Martinez in 1999). His ERA- in 2013 was 35.3, just behind Pedro Martinez’ record 35.0 ERA- in 2000. According to Fangraphs’ RA9 WAR, Pedro was worth a staggering 12.3 wins that season, and he only threw 5 more innings than Tanaka threw in Japan last year.
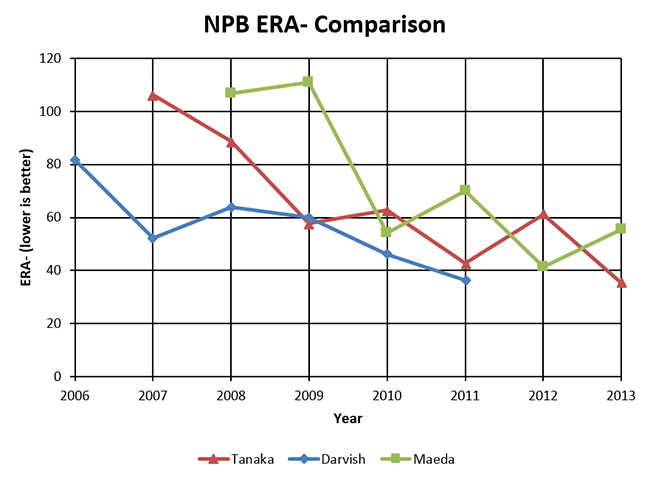
Tanaka has thrown three seasons in a row that would rank in the top 10 in MLB history by ERA- or FIP-. That’s really impressive, but it doesn’t mean much without seeing how common extreme values are in Japan. The following chart compares Tanaka’s NPB ERA- to NPB ERA- values for Yu Darvish and Kenta Maeda (who may be posted after next season):
While Tanaka has the best single-season ERA- value of these three pitchers, Darvish had an ERA- of 36 in 2011 and Maeda had an ERA- of 41 in 2012. Extreme ERA- values, such as the ones that Tanaka has posted over the last few seasons, do not seem to be very unusual in NPB right now. All three pitchers have had seasons that would rank among the all-time best MLB seasons in the very recent past.
Darvish had slightly worse peak adjusted stats in NPB than Tanaka, but that doesn’t mean that Tanaka will be better in the MLB. Most scouts say that Darvish is better in the MLB than Tanaka will be. However, it’s still fun to see how dominant Tanaka was in Japan. He concluded his Japanese career by winning the Nippon Series, further cementing his legacy. It’s hard to see what else he would have been able to accomplish there. Whichever team signs him this week is certainly hoping that he will have similar results in America.
—
Footnotes
* Park factor methodology: I used the park factors found here: http://subjspeak.blogspot.com/2012/12/npb-park-factors-for-2006-2012.html
A few unresolved questions from this article led to assumptions when making park-adjusted calculations in the main post body (attempts to reach the author of the post failed). The article does not state if the park factors presented are for the stadium or for the team, so I assumed they were for the stadium. This moves the park factors closer to neutral when applying them to the players, since the player’s away games will be in an approximately league average environment.
Assuming that the numbers in that post are for the stadium produces a 35.3 ERA- for Tanaka in 2013, as is shown in the post above. If it is used as a player park factor (opposite assumption), his ERA- would improve to 34.9. Darvish’s 2011 ERA- would increase from 36.4 to 37.4 if using the opposite assumption. Maeda’s 2012 ERA- would increase from 41.5 to 42.1. The magnitude of these changes are pretty small, but worth mentioning since I’m not 100% confident in this method.
The data in the NPB park factor post is also missing data for the 2013 season, so I assumed that the Hiroshima and Rakuten park factors remained the same as their 2012 values. Those park factors have both been steady for the last few seasons, and regression/weighting would heavily favor the previous stable period if there was a change this year. Since the same regression assumption cannot be made for missing park factor data prior to 2006, I removed Darvish’s 2005 ERA- from the NPB comparison chart.
** In order to calculate FIP for Tanaka, the MLB weights (13*HR, 3*BB/HBP, 2*K) are used. It’s possible (likely?) that the weights given to these statistics should be different for NPB. Using the same equation for both leagues is a convenient way to compare pitchers in different environments, like what is done between Kershaw and Tanaka above.
—
This post uses the following statistics:
- ERA: Earned Run Average.
- ERA-: ERA, park adjusted and compared to league average. 100 ERA- is a league average pitcher by ERA, 90 ERA- is 10% better ERA than league average, etc. Explanation here.
- FIP: Fielding Independent Pitching. Attempts to create an ERA-like number using only plays that do not require defense to complete (K, BB, HR) by assuming the pitcher is playing in front of a league average defense. Explanation here.
- FIP-: FIP, park adjusted and compared to league average. 100 is a league average pitcher by FIP, 90 is 10% better FIP than league average, etc. Explanation here.
- RA9 WAR: Pitcher wins above replacement, calculated using the runs a pitcher allows as the main metric (combines fielding independent and fielding dependent metrics). Explanation here.
 Dodgers Digest Los Angeles Dodgers Baseball Blog


