 Dodgers Digest Los Angeles Dodgers Baseball Blog

The Dodgers have been relatively quiet this offseason, except in the bullpen. The most confusing signing of the bunch was that of Chris Perez, which doubled their number of “closers who lost their job last season because they were awful.” Brandon League also fits into that category, and probably isn’t going anywhere since he’s still owed 15 million dollars over the next two seasons.
Since both pitchers will be on the roster when the season starts (barring injury), the Dodgers are hoping that they can return to their previous level of performance. By digging deeper into last season’s numbers, it might be possible to see if either pitcher was particularly unlucky last year and the magnitude of a possible improvement next season.
The basic stats show that both Perez and League had very different ERA numbers, but both pitchers had similar FIPs:
| ERA | ERA- | IP | K/9 | BB/9 | HR/9 | FIP | FIP- | fWAR | |
| League, 2013 | 5.30 | 149 | 54.1 | 4.64 | 2.48 | 1.33 | 4.93 | 137 | -1.0 |
| Perez, 2013 | 4.33 | 113 | 54 | 9.00 | 3.50 | 1.83 | 5.08 | 133 | -0.9 |
ERA and ERA- are not great statistics to use for relief pitchers, since sequencing and batted ball luck are extremely prevalent in relief pitcher samples. When using FIP components (HR, K, BB, and HBP), League and Perez are nearly identical, with League a bit worse after adjusting the numbers for park and league. League’s strikeout rate was about half of Perez’ last season, but his lower walk rate and lower home run rate were more than enough to close the FIP gap. League’s 137 FIP- was second worst among relievers with at least 50 innings pitched last season, while Perez was the fourth worst.
Looking at batted ball data (and SIERA) is a useful way to see if either pitcher was particularly unlucky last season:
| GB/FB | LD% | GB% | FB% | IFH% | Balls in play | SIERA | |
| League, 2013 | 2.83 | 19.1% | 59.8% | 21.1% | 14.3% | 199 | 3.70 |
| Perez, 2013 | 1.22 | 22.8% | 42.4% | 34.8% | 1.5% | 158 | 3.47 |
At first glance, this data appears to favor League. He did a better job keeping the ball on the ground and allowed a lower percentage of line drives. He also allowed 17 infield hits last season, which could be an indicator of bad luck. To put that into context, League gave up more infield hits than 45 starting pitchers who qualified for the ERA title in 2013 (>162 IP).
However, League allowed more balls in play than Perez, since he couldn’t strike anybody out. As a result, League’s SIERA (an ERA estimator which uses batted ball data and other inputs) was a bit worse than Perez’ last season. Both pitchers had SIERAs that were better than their league average (3.85 for NL, 3.89 for AL), and both pitchers’ SIERA was significantly better than their corresponding ERA and FIP. This might point to bad luck last season, and might point to positive regression potential for both.
There is one stat that I left out of the previous tables that I feel deserves a bit more attention. League and Perez both had surprisingly okay xFIPs last season:
| FIP | FIP- | HR/FB | xFIP | xFIP- | |
| League, 2013 | 4.93 | 137 | 19.0% | 4.07 | 108 |
| Perez, 2013 | 5.08 | 133 | 20.0% | 3.83 | 97 |
xFIP uses the same components as FIP, but substitutes an expected home run total in place of the actual home run total. The expected home run total uses the number of fly balls a pitcher allows and the league average HR/FB ratio (10.5% last season). Since a pitcher’s HR/FB ratio is highly variable, using the expected home run total can potentially be more reflective of the pitcher’s actual skill.
The reason why League and Perez’ xFIPs are so much better than their FIPs is because both pitchers had very high HR/FB ratios last season. Even after normalizing the home run total, League’s xFIP- was 12th worst among relievers with at least 50 innings pitched. Perez saw a bigger benefit, ending up at 45th worst overall.
However, there is more data available that can help determine if a pitcher’s HR/FB ratio is a fluke. Baseballheatmaps.com tracks the average distance of fly balls (including home runs) that a pitcher allows. Below is a plot with Perez and League’s 2013 fly ball distance overlaid:
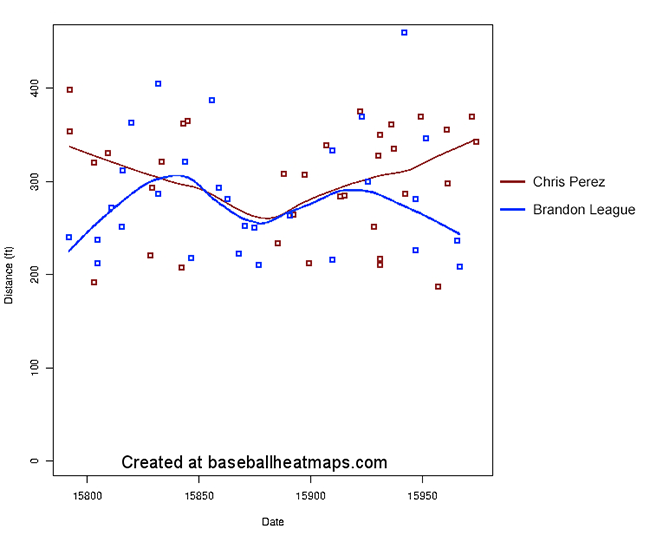
On average, League’s fly balls traveled 285 feet and Perez’ fly balls traveled 301 feet.
While baseballheatmaps doesn’t make its pitcher fly ball distance data available in a leaderboard, it does have a leaderboard for hitters. Perez’ average fly ball distance was closest to David Ortiz, who was 16th among the 300 hitters on the leaderboard last season. League’s 285 feet would still be above the hitter median (280 feet, set by Juan Uribe), but it would have been 116th among hitters, between Victor Martinez and Eric Chavez.
Last year, FanGraphs took an extensive look into the correlation between fly ball distance and HR/FB ratio. Part 1 of the series examines the correlation between fly ball distance and HR/FB ratio for hitters, using fly ball distance as the only input. They used batted ball location to improve their correlation later in the series, but that input data is not fully available to the public.
In theory, the same correlation for hitters can also work for pitchers (most likely with more variance due to smaller sample sizes). Using the fit line equation from the linked article, I calculated League and Perez’ “expected” HR/FB ratio. Then I substituted the expected HR/FB ratio in place of the league average ratio in the xFIP equation. This calculation creates a modified version of xFIP using batted ball distances, which I am calling bxFIP.
Below are the bxFIP calculations for Perez and League, along with a comparison to their league averages (bxFIP-):
| Actual HR/FB Ratio | Average FB Distance | Expected HR/FB Ratio | bxFIP | bxFIP- | |
| League, 2013 | 19.0% | 285 ft | 11.5% | 4.16 | 110 |
| Perez, 2013 | 20.0% | 301 ft | 16.4% | 4.61 | 119 |
Using the HR/FB correlation, League’s numbers are a little bit better than Perez’. League’s bxFIP is closer to his xFIP, but Perez’ bxFIP is closer to his regular FIP.
This method isn’t perfect. Average fly ball distance does not account for park factors (though the Dodgers and Indians have similar HR factors). A sample of the average distance of approximately 30 fly balls is probably not very stable. More investigation would be needed to see if this method correlates better with actual performance than regular xFIP, but that’s beyond the scope of this article.
Yet another way we can evaluate Perez and League’s potential to regress in 2014 is to use projection systems. The two main projection systems that are already available are Steamer and ZiPS. Here are the projections for League and Perez next season:
| IP | ERA | ERA- | FIP | FIP- | WAR | |
| League, Steamer 2014 | 32.0 | 3.58 | – | 3.62 | – | 0.0 |
| League, ZiPS 2014 | 60.1 | 4.03 | 111 | 3.72 | 103 | -0.1 |
| Perez, Steamer 2014 | 40.0 | 3.29 | – | 3.60 | – | 0.0 |
| Perez, ZiPS 2014 (Indians) | 58.1 | 4.47 | 115 | 4.53 | 117 | -0.3 |
There are some slight issues with these data. Steamer does not project ERA- and FIP-, so I had to leave those cells blank. Additionally, Perez’ projection assumes that he is still on the Indians, since the Dodgers had not signed when the Dodgers ZiPS post was written. In a later tweet, Dan Szymborski posted updated projections for Perez as a Dodger, but he did not include FIP. The tweet shows scaled ERA in terms of ERA+; a 92 ERA+ is equivalent to a 109 ERA-, so Perez is projected to do a little bit better in relation to league average in the National League than in the American League.
Overall, Steamer projects Perez and League to be very similar next season. Their FIPs are nearly identical, and Perez is projected to be slightly better by ERA-. Both pitchers are projected to be replacement level pitchers next season.
After using Perez’ NL ERA-, ZiPS also projects him to be slightly better than League by run prevention. However, it is extremely pessimistic about Perez’ FIP. Overall, ZiPS projects a slightly better WAR for League, but both pitchers are below replacement level.
An area of concern next season that isn’t directly captured in any of these numbers is fastball velocity. Both League (0.8 mph) and Perez (1.3 mph) lost velocity on their primary fast pitch last season. If either pitcher can re-gain that velocity, it could improve their overall results by allowing them to miss more bats. Perez’ velocity loss corresponded with an injury (shoulder tendinitis), but spending time on the DL did not immediately cause his velocity to rise. As a result, League is probably a bit more likely to recover his lost velocity, though it seems a bit unlikely for either pitcher.
Here’s a summary of the statistics cited in this article, along with career numbers.
| ERA | ERA- | FIP | FIP- | xFIP | xFIP- | bxFIP | bxFIP- | SIERA | |
| League, 2013 | 5.30 | 149 | 4.93 | 137 | 4.07 | 108 | 4.16 | 110 | 3.70 |
| League, Career | 3.80 | 94 | 3.94 | 97 | 3.67 | 88 | – | – | 3.67 |
| Perez, 2013 | 4.33 | 113 | 5.08 | 133 | 3.83 | 97 | 4.61 | 119 | 3.47 |
| Perez, Career | 3.41 | 85 | 4.11 | 102 | 4.13 | 100 | – | – | 3.58 |
The good news is that both pitchers have a pretty decent chance to improve next season. League’s ERA was mostly supported by his awful FIP, but xFIP, bxFIP, and SIERA all point to some bad luck on batted balls and are significantly below the ERA and FIP. Perez’ numbers are a bit more mixed (FIP and bxFIP higher than ERA), but his xFIP and SIERA also point to potential to improve. If their career numbers are used as a realistic target for regression, Perez is a little bit better, especially by ERA-. League has been better by FIP and xFIP, but neither pitcher has career numbers very far from average.
The bad news is that the numbers don’t point to either pitcher to be very good. Their career averages aren’t anything special, and projection systems don’t think they’ll recover much beyond replacement level. Both pitchers had concerning drops in fastball velocity last season, and Perez’ shoulder could still be a concern going forward. Neither pitcher has career numbers very far from league average. Their saves masked the actual numbers behind them.
However, at this point, the Dodgers will at least find solace in the potential for improvement (even if it means that Chris Withrow might start the season in the minors). There’s potential for a bit of added value between the two pitchers, even if the Perez signing is still a bit odd.
—
This post uses the following statistics:
- ERA: Earned Run Average.
- ERA-: ERA, park adjusted and compared to league average. 100 ERA- is a league average pitcher by ERA, 90 ERA- is 10% better ERA than league average, etc. Explanation here.
- FIP: Fielding Independent Pitching. Attempts to create an ERA-like number using only plays that do not require defense to complete (K, BB, HR) by assuming the pitcher is playing in front of a league average defense. Explanation here.
- FIP-: FIP, park adjusted and compared to league average. 100 is a league average pitcher by FIP, 90 is 10% better FIP than league average, etc. Explanation here.
- HR/FB ratio: The number of home runs a pitcher allows divided by the total number of fly balls allowed.
- xFIP: Expected FIP, which is the same as FIP but normalized with a league average HR/FB ratio. Explanation here.
- xFIP-: xFIP, park and league neutralized and scaled to league average. 100 xFIP- is a league average pitcher by xFIP, 90 xFIP- is 10% better xFIP than league average, etc. Explanation here.
- SIERA: Skill interactive ERA, an ERA estimator that uses batted ball data and other inputs. Explanation here.
- bxFIP: Batted ball expected FIP, calculated using an “expected” HR/FB ratio using fly ball distances. Explanation in this post.
- bxFIP-: bxFIP, park and league neutralized and scaled to league average. 100 bxFIP- is a league average pitcher by bxFIP, 90 bxFIP- is 10% better bxFIP than league average, etc.
- Steamer, ZiPS: Systems used to project future player performance. Explanation here.