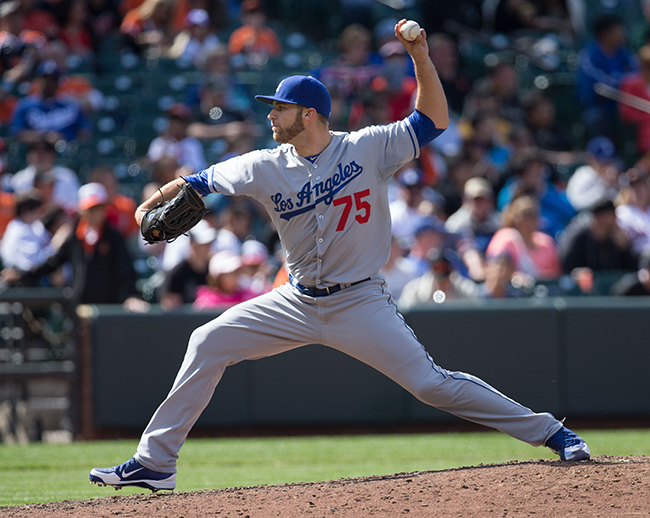
For most of the year, Paco Rodriguez was one of the most dependable pitchers in the Dodgers’ bullpen. He was unhittable against lefties and nearly as good against right-handed hitting. This lasted until September, when he completely fell apart. He was so ineffective at the end of the season that he was left off of the NLCS roster against a Cardinals team that could not hit left-handed pitching.
Here’s a table showing the magnitude of Rodriguez’ fall:
| Month | BA | OBP | SLG | wOBA | FIP |
| April | .179 | .267 | .222 | .230 | 2.21 |
| May | .100 | .206 | .200 | .196 | 3.37 |
| June | .167 | .268 | .171 | .202 | 2.39 |
| July | .103 | .138 | .107 | .117 | 0.77 |
| August | .135 | .179 | .216 | .180 | 2.08 |
| September | .296 | .438 | .731 | .468 | 9.84 |
| October* | .667 | .750 | 1.167 | – | 28.55 |
*Playoffs. Extremely small sample (8 batters faced), and Fangraphs does not calculate playoff wOBA. This sample is combined with September’s as often as possible in this article.
The purpose of this piece is to look deeper into the end of Rodriguez’ season to see what happened in greater detail and to see if there was any visible cause of his rapid decline.
—
Walk rate/control
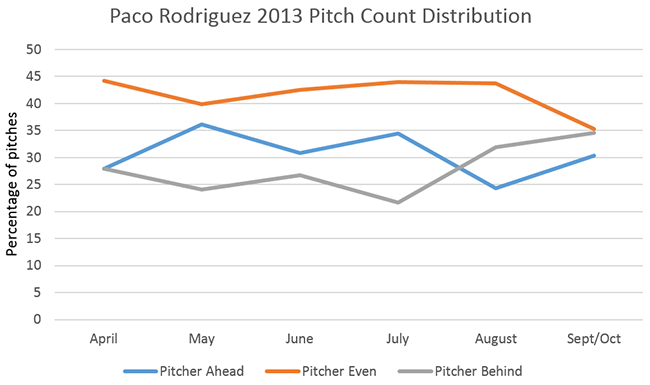
One major issue that plagued Rodriguez was a large spike in his walk rate. In September and October, Rodriguez walked 11 batters (4 intentional) in 7 innings. From April to August, he walked 13 batters (1 intentional) in 48 innings. In addition to the extra walks, Rodriguez found himself working from behind in the count more often at the end of the season:
In September and October, Rodriguez threw 35% of his pitches while behind in the count, and just 35% while ahead. Looking at how the Rodriguez’ pitch selection changes by situation can help show the impact of pitching from behind in the count:
| Ahead LHH | Even LHH | Behind LHH | Ahead RHH | Even RHH | Behind RHH | |
| Fourseam | 2% | 7% | 13% | 7% | 5% | 5% |
| Sinker | 6% | 9% | 11% | 9% | 30% | 14% |
| Cutter | 20% | 38% | 39% | 35% | 30% | 53% |
| Slider | 73% | 45% | 37% | 31% | 21% | 13% |
| Change | 0% | 1% | 0% | 19% | 13% | 14% |
When Rodriguez was ahead of left-handed hitters last season, he threw his slider nearly 3/4 of the time. After falling behind, the use of his slider was halved. As a result, he had to rely more on his sinker and cutter. Rodriguez’ pitch distribution changed against right-handed hitters as well, though the difference was not as extreme. While ahead in the count, he used his cutter and slider most often while frequently mixing in a change. After falling behind, he relied more on cutter, reducing usage of both the change and slider.
Overall, when Rodriguez was ahead in the count, he threw his best pitches in the locations that were hardest to hit, as most pitchers do. Last season, Rodriguez allowed a batting line of .116/.141/.217 while he was ahead in the count, and .204/.420/.347 while he was behind. This doesn’t fully explain Rodriguez falling apart at the end of the season, but it was definitely a factor.
However, looking at Rodriguez’ Pitch F/X data doesn’t help to clarify the increased walk rate or the increase in pitches thrown while behind in the count:
| April-August | September-October | |
| Pitches in Pitch F/X Strike Zone | 33.9% | 35.2% |
| Swing rate on out-of-zone pitches | 39.1% | 40.2% |
| First pitch called a ball | 41.0% | 44.7% |
| First pitch in Pitch F/X Strike Zone | 36.4% | 36.8% |
Rodriguez actually threw more pitches in the Pitch F/X strike zone at the end of the season than he did at the beginning. Additionally, he got hitters to swing at pitches outside of the strike zone at a higher rate at the end of the season.
Rodriguez allowed more balls on the first pitch of an at-bat at the end of the season, which is a primary cause of the increased number of pitches thrown while behind in the count. However, the Pitch F/X strike zone doesn’t agree with this change; his first pitch was in the Pitch F/X zone at almost an identical rate during both time periods.
Overall, these data have some conflicts. It could indicate unlucky umpiring, or just poor luck during a small sample. For now, I’ll move on, and see if we can find a more complete explanation while examining other issues.
—
Balls in play
Walks were only a fraction of the problems that plagued Rodriguez at the end of the season. Between April and August, Rodriguez allowed an ISO (Isolated power) of .045. During that period, he allowed 22 hits, only three of which were for extra bases (two home runs, one double). In September and October (including the playoffs), Rodriguez allowed an isolated power of .438. At the beginning the season, Rodriguez allowed one extra base per 22.2 at-bats. At the end of the season, he allowed one extra base per 2.3 at-bats, almost ten times the previous rate.
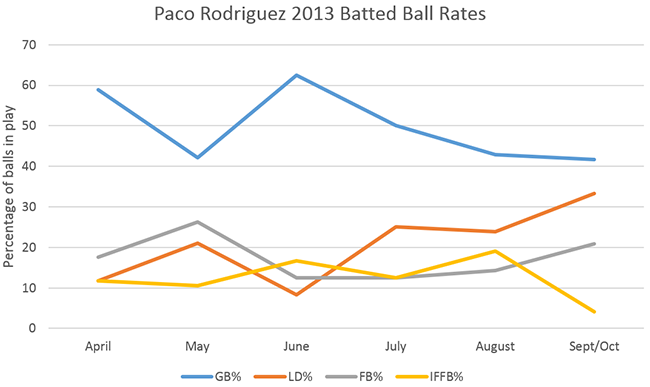
The cause of the increased power is pretty easy to trace. Rodriguez allowed much harder contact at the end of the season:
At the end of the season, all lines on the above graph moved in the wrong direction. The lines that should be high (ground balls, infield fly balls) went down, and the lines that should be low (line drives, fly balls) both went up. This is not a recipe for success, and Rodriguez felt the full impact of the results. This is a clear cause of the increased power against Rodriguez at the end of the season, but the cause of the increase in hard contact still needs to be found.
—
Fatigue/Command
Rodriguez was subject to a higher workload in 2013 than he has been previously. He recently stated that he was a bit tired at the end of the season:
“Last year, I thought I prepared well enough, but at the end I might have gotten a little tired and I didn’t pitch as well as I wanted to. I felt like I had to work a little harder just to get to that point where I can last a whole season.”
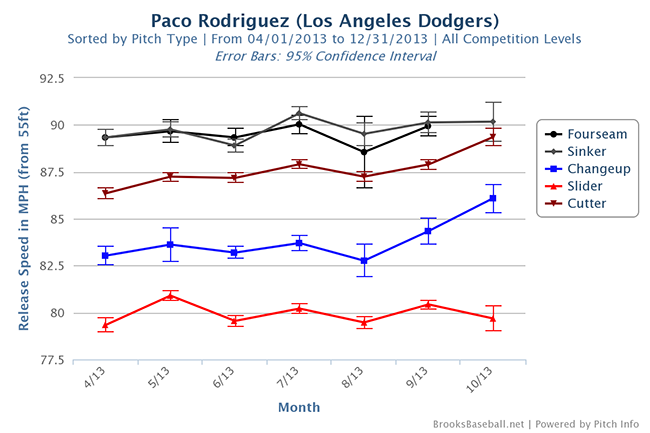
If he was tired, it didn’t show up in his pitch velocity:
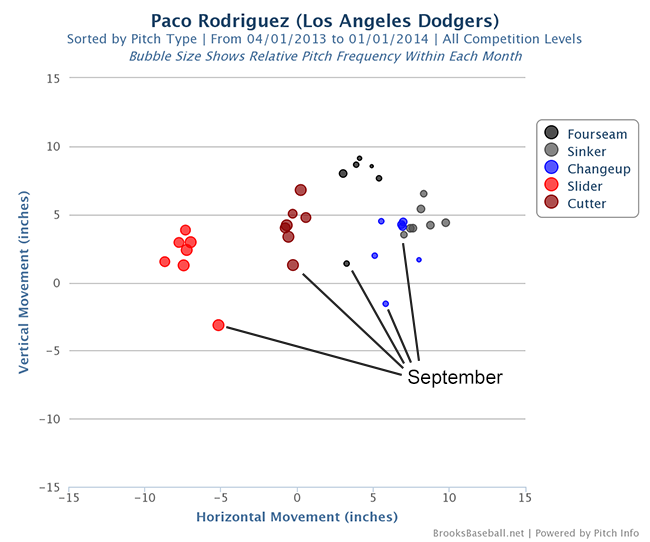
However, there was a major change that could have been caused by fatigue. And I think that it could be the root cause of most of the other issues that I have outlined in this article. The chart below shows the horizontal and vertical component of Rodriguez’ pitch movement in 2013. Each point represents a month’s worth of pitches. I’ve highlighted the September data points:
All of his pitches had much less movement in September than they had during the rest of the season. The most dramatic effect was in Rodriguez’ slider, his best pitch for most of the year. According to the data from Brooks, his slider averaged 7.33 inches of horizontal movement between April and August, which decreased to 5.19 inches in September. The vertical movement changed from +2.57 inches to -3.14 inches. Throughout most of the season, Rodriguez’ slider was among the league’s best in horizontal break. Since his slider doesn’t rely on velocity to be effective, a reduction in movement can have severe consequences.
Rodriguez’ cutter also flattened out in September (-0.29 inches horizontal movement, +1.27 inches vertical movement). Rodriguez turns to that pitch more often when he’s behind in the count, which happened more often at the end of the season. Since his cutter had less movement, hitters were able to make better contact. Between April and August, batters hit 6 line drives on the 34 cutters put into play, a rate of 17.6%. In September and October, batters hit 6 line drives on the 17 cutters they put into play, exactly double the rate from earlier in the season.
The reduction in movement explains the increase in Rodriguez’ line drive rate. It also might also explain the discrepancy between Rodriguez’ increased walk rate (and number of pitches from behind in the count) and the Pitch F/X strike zone. The change in pitch movement and fatigue could have caused him to miss his target by more, resulting in fewer called strikes due to poorer pitch framing. It’s not a perfect explanation, but it closes the gap a bit.
—
Conclusion
Since Rodriguez stated that he was fatigued at the end of the season, there’s a potential cause for the change in pitch movement. The decrease in movement led to the increase in hard contact and potentially the increased walk rate. Rodriguez’ pitch breaks nearly returned to normal in his two October appearances. The results didn’t follow the change, but it’s a lot easier to claim “small sample size” with eight plate appearances. Since fatigue can explain Rodriguez’ late-season results so well, there’s reason to be optimistic about his chances to rebound in 2014.
—
This post uses the following statistics:
- wOBA: Weighted on-base average, a statistic used to calculate overall offensive value by using unique weights for different types of hits. Explanation here
- FIP: Fielding Independent Pitching. Attempts to create an ERA-like number using only plays that do not require defense to complete (K, BB, HR) by assuming the pitcher is playing in front of a league average defense. Explanation here.
- GB%, LD%, FB%, IFFB%: Ground ball rate, line drive rate, fly ball rate, infield fly ball rate.
 Dodgers Digest Los Angeles Dodgers Baseball Blog
