 Dodgers Digest Los Angeles Dodgers Baseball Blog
On Monday, Baseball Prospectus published an article introducing new methodology to quantify the impact of catcher framing. Dan Brooks and Harry Pavlidis collaborated to create the numbers, which they have been working on for most of the offseason. The analysis of pitch framing, which uses Pitch F/X data to see when a catcher “changes” a ball to a strike, has been an area of intense focus among the sabermetric analysis community. Since the analysis of the impact of framing is in its early stages, it is exciting to follow along with the development of new measurement methodologies. And, since this is a Dodgers blog, we can see how the new framing data views Dodger catchers.
First, the caveats:
1. Since the analysis of framing is so new, the magnitude of the impact of framing vary depending on who you ask. A new analysis might come out tomorrow that says that framing is worth half the magnitude or there might be other influences that this new analysis does not take into account. There’s a reason why catcher framing is not yet included in WAR or WARP.
2. BP’s summation of catcher defense does not include control of the running game, an area of strength for the Dodgers. Part of this is pitcher influenced, but catchers also have an impact. The BP catcher evaluation model also does not include anything on pitch calling or how a catcher handles a pitching staff. These are things that A.J. Ellis does well, from everything that we’ve heard.
What does Baseball Prospectus’ new framing analysis do differently than what we’ve seen before?
Previous framing analyses have assumed that all strikes which are changed to balls (and vice versa) have the same impact. This new analysis assigns an individual run value to a frame on each count. A successful frame on a 3-2 count (changing a walk to a strikeout) counts more than a successful frame on the first pitch. The run value assigned also depends on the probability that a pitch in a particular location is called a ball or a strike with “neutral” framing.
The analysis also takes other new factors into account. Based on a pitcher’s arsenal and control, their impact on a catcher’s framing can be determined. Per the article, Brandon League has the worst impact (on a rate basis) on catcher framing. Essentially, this means that he has one of the smallest strike zones in baseball. Dan Haren is on the opposite side of the leaderboard, creating one of the largest positive impacts on framing. Brooks and Pavlidis have stated that they will publish the full leaderboard in the future, so we will get an opportunity to see the influence of other Dodgers pitchers as well.
The BP framing analysis also accounts for the umpire and adds a bit of regression. They have also applied all of the above methods to pitch blocking, another significant portion of catcher defensive value.
What does this mean for the Dodgers’ catchers? As the figure below shows, it isn’t pretty.
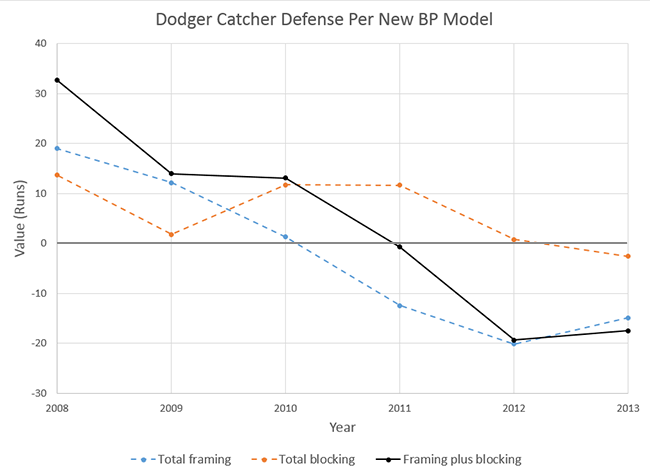
The overall defensive contribution of the Dodgers catchers has dramatically declined since Russell Martin‘s departure. In 2011, the team’s overall defensive value was nearly neutral, thanks mostly to Rod Barajas‘ 9.3 blocking runs above average. In 2012 and 2013, the overall defensive value has been amounted to nearly two lost wins per season.
Let’s break down the last two years a bit more. Below is a table of each player who has caught for the Dodgers during that time period, both on a counting and rate basis. 7000 framing opportunities (as noted in the “/7000” statistics) is approximately one season for the primary catcher, so that is what the rate stats are based on. Each /7000 stat corresponds to the raw counting stat on its left. Catchers with less playing time (Butera, Hernandez, etc) will have a bigger difference between their rate stats and counting stats and will have higher small sample volatility.
| Year | Player | Framing Runs Above Average | FrRAA/7000 | Blocking Runs Above Average | BRAA/7000 | Total Receiving Runs Above Average | RRAA/7000 |
| 2013 | A.J. Ellis | -12.0 | -13.73 | -3.0 | -2.9 | -15.0 | -16.1 |
| 2013 | Tim Federowicz | -1.1 | -3.1 | 0.4 | 0.8 | -0.7 | -2.4 |
| 2013 | Ramon Hernandez | -1.7 | -18.9 | 0.0 | 0.0 | -1.7 | -18.9 |
| 2013 | Drew Butera | -0.1 | -4.4 | 0.0 | 0.0 | -0.1 | -4.4 |
| 2012 | A.J. Ellis | -14.9 | -13.8 | -0.5 | -0.3 | -15.4 | -14.1 |
| 2012 | Matt Treanor | -5.1 | -18.4 | 1.3 | 3.3 | -3.8 | -15.2 |
| 2012 | Tim Federowicz | -0.1 | -10.6 | 0.0 | 0.0 | -0.1 | -10.6 |
As you can see, A.J. Ellis’ defensive numbers are pretty disappointing. He was worth -12 framing runs above average and -3 blocking runs above average last season. By raw counting value, he was the sixth-worst framer, the seventh-worst blocker, and the fourth-worst combined defender. By rate, his defense was fifth-worst last season. He wasn’t much better in 2012; fifth-worst by overall defense.
Ellis’ back-up, Tim Federowicz, fared a bit better last season. He’s listed as a below-average framer, but a slightly above-average pitch blocker. This adds up to a slightly below-average combination of the two defensive numbers, which is counter to his reputation.
The new model at Baseball Prospectus has different evaluations on Ellis than an older model found at StatCorner. Baseball Prospectus evaluates Ellis’ 2013 framing value to be -12.0 runs, while StatCorner evaluates it as -7.4 runs. StatCorner (-16.0 runs) is harsher on Ellis’ 2012 framing than BP (-14.9).
Searching through the Baseball Prospectus numbers show a few examples who were at or below Ellis’ level improving their framing numbers. Carlos Santana was worth -34 FrRAA/7000 in 2012, but was worth -7.7 in 2013. Dioner Navarro went from -23.4 FrRAA/7000 in 2008 to -6.4 FrRAA/7000 in 2009. Despite the two positive examples, big improvements from a large negative framing value are relatively rare among catchers with significant sample sizes. Teams could be recognizing the value removed by poor framing and substituting better catchers, but it’s more likely that they haven’t recognized (or, perhaps, disagree with) the impact of framing.
No matter which model you ask, they draw the same conclusion: pitch framing is a weakness on the Dodgers. The magnitude of its importance is still being determined, but hopefully A.J. Ellis will take steps to improve his receiving in 2014.
—
This post uses the following statistics:
- FrRAA/7000: Framing runs above average per 7000 framing opportunities
- BRAA/7000: Blocking runs above average per 7000 blocking opportunities
- RRAA/7000: Receiving runs above average per 7000 framing opportunities. Sums framing and blocking inputs