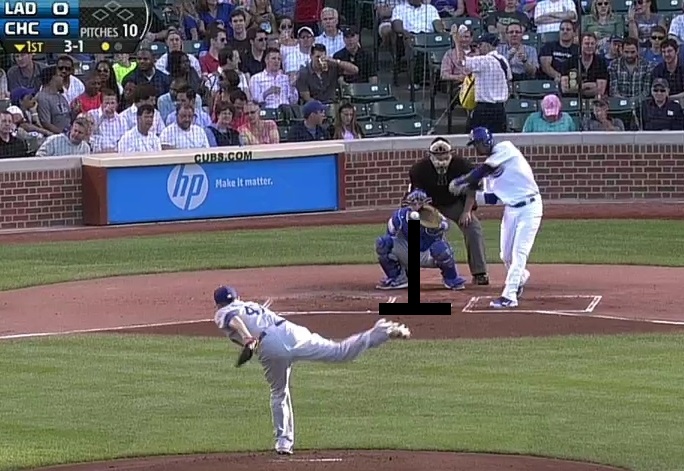
Fans are always analyzing which pitchers have the best and worst pitches, but we normally base that on nothing but our own feelings in the moment, so I decided to take a more objective look at things.
For a pitch to qualify for these rankings, I used a 200-pitch minimum for starters and a 50-pitch minimum for relievers. The metric used to measure pitch effectiveness is True Average (TAv), which is basically like wOBA … but on Baseball Prospectus. League average performance is set at .260, and the metric doesn’t include baserunning.
Additionally, to prevent the post from being solely numbers-based, and one that would have been mind-numbingly boring, I decided to provide visual evidence as well.
And yes, none of this factors in usage rate or sequencing or sample sizes. So just have fun with it.
Leggo.
=====
Worst Overall Pitches – Starters
Matt Magill – Fastball – .332
Ricky Nolasco – Fastball – .303
Edinson Volquez – Sinker – .301
Worst Overall Pitches – Relievers
Josh Wall – Fastball – .595
Peter Moylan – Sinker – .441
J.P. Howell – Change – .415
While the most frequently used pitch will always be hit a little harder than others, it’s never a good sign when said most frequently used pitch is being hit at an All-Star level by the opposition, which is basically what happened to our starting pitching trio. The relievers? More like a Hall Of Fame level. The first two are pretty obvious inclusions, and both aren’t with the team anymore. J.P. Howell is a surprise, but he didn’t use that change much last year, probably for a reason.
=====
Worst Individual Pitches
Fastball/Sinker/Cutter
Starters
Matt Magill – Fastball – .332
Ricky Nolasco – Fastball – .303
Edinson Volquez – Sinker – .301
Relievers
Josh Wall – Fastball – .595
Peter Moylan – Sinker – .441
Ronald Belisario – Fastball – .367
Curve/Slider
Starters
Hyun Jin Ryu – Curve – .290
Chris Capuano – Slider – .253
Edinson Volquez – Curve – .247
Relievers
Brandon League – Slider – .299
Peter Moylan – Slider – .284
Carlos Marmol – Slider – .243
Change/Split
Starters
Ricky Nolasco – Split – .289
Relievers
J.P. Howell – Change – .415
=====
Worst Pitch Of 2013
Hyun Jin Ryu – Curve – .290
Despite the fact that he has three other quality pitches to put opposing hitters off his curve, and despite the fact that he only throws it 9.5% of the time, it’s still the ninth-worst curve in the MLB out of 104 qualified pitchers.
Fortunately, he has other quality pitches that make him awesome and has apparently re-worked his curve in the off-season. It needed it.
Brandon League – Slider – .299
He only used his slider 9.4% of the time, so you would think he could get the drop on hitters once in a while. But most of the time he threw it, they hit it hard. His slider ranked 22nd in the MLB out of 210 qualifying pitchers, but increase the standards to 100 pitches thrown? He’s eighth out of 155. Yeesh.
That’s his out-pitch the league is hitting at an All-Star level.
So yeah, there’s a reason he’s the last man out of the pen.
 Dodgers Digest Los Angeles Dodgers Baseball Blog
