 Dodgers Digest Los Angeles Dodgers Baseball Blog
Dan Haren has been one of the Dodgers’ best pitchers so far this year by many measures. He leads the team in FIP-based WAR and has a 2.68 ERA in 43-2/3 innings. The team has to be thrilled with their return on a relatively small investment, especially given Clayton Kershaw and Hyun-jin Ryu‘s health issues.
Yet, despite Haren’s good numbers, there are some things to be worried about. His velocity is significantly down from last season and he might be dealing with back problems. As a result of the reduced velocity, perhaps, Haren’s swinging strike rate is down by a significant amount. Haren’s 6.2% swinging strike rate is by far the worst of his career and is the 9th lowest swinging strike rate among qualified starters (Paul Maholm is not qualified due to his time in relief, but he would be worst on the list if he did).
Despite the reduction in swinging strike rate, Haren’s strikeout rate hasn’t gone down by much. Haren has struck out 19.5% of the batters he has faced this year, down only slightly from his career rate of 20.5%. There’s a bit of a conflict here. Intuitively, Haren’s severe drop in swinging strike rate would cause a nearly equally severe drop in strikeout rate.
To check to see if my perception of a disconnect was real, I used Fangraphs’ invaluable pitching correlation tool. I plotted the relationship between same-year swinging strike rate and strikeout rate, restricting the sample to starting pitchers with over 160 innings pitched (that way we can see what a bigger sample will do to Haren’s numbers). The correlation between the two statistics is very strong (0.831). Then I added in Haren’s career numbers and what he has done so far this year:
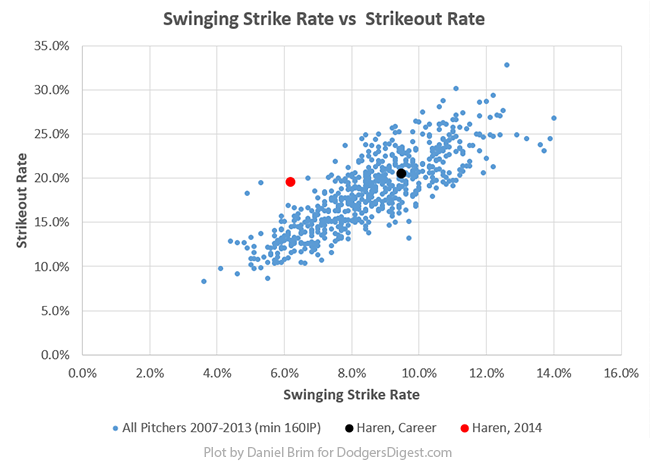
The red dot, Haren’s current 2014 numbers, deviate significantly from most of the other points on the plot. There’s a small handful of outliers in that area (to his left are Bartolo Colon in 2011 and Mike Mussina in 2008), but for the most part Haren is pretty far away from a normal strikeout rate given his low swinging strike rate.
I believe that the primary cause for Haren’s position as an outlier on the above plot is a high rate of looking strikeouts. So far this season, Haren has 36 strikeouts. 18 of the strikeouts have been looking (50%) and 18 have been swinging.
There is some evidence which would suggest that Haren might have the ability to maintain a high looking strikeout rate. He has always had excellent command, and he is therefore one of the best pitchers in baseball at getting extra strikes from pitch framing. As a result, Haren pitches to a larger strike zone than most other pitchers. The less a catcher has to move his glove to receive a ball, the more likely he is to get the desired call.
Haren’s framing effect has continued this year. Thanks to Baseball Prospectus’ framing battery numbers, we can get a look at how catchers are receiving Haren compared to how they’re receiving other Dodgers pitchers. So far this year, Haren and his battery-mates have combined for +11.5 extra strikes, which equates to 1.6 framing runs above average. All other Dodger pitcher/catcher combinations have combined for -22.3 strikes, or 4.3 runs below average. That’s an increase of more than half a win in framing value while Haren is on the mound, which would correspond with a larger strike zone.
When I saw Haren’s looking strikeout rate this season, I figured it must be a skill that Haren has some control over due to his impact on pitch framing. However, this has not been the case so far in Haren’s career. Haren’s career looking strikeout rate is 26.3%, not much higher than the league average rate of 25%. Additionally, Haren’s career numbers do not deviate significantly from the correlation above.
So, what does this mean? In my previous blog’s short life, I looked into regressing a high rate of looking strikeouts. The premise behind the adjustment is that the number of swinging strikeouts holds some predictive power for the number of looking strikeouts, and that the extra looking strikeouts can be at least partially attributed to luck. The subject in that series of posts was Brian Wilson, who had a looking strikeout rate higher than 50% in 2013. The basic idea of the simple model is to “remove” the unexpected looking strikeouts, then redistribute the results based on the new count.
Since Haren has 18 swinging strikeouts so far this season, the “expected” number of looking strikeouts based on Haren’s career looking strikeout rate is 6.42, compared to the actual value of 18. Therefore, 11.58 plate appearances which ended in a looking strikeout would be expected to continue. A “removed” 0-2 looking strikeout would continue with a 1-2 count, 1-2 as 2-2, 2-2 as 3-2, and a “removed” 3-2 looking strikeout would result in a walk. The number of plate appearances continuing for each count is scaled proportionally to the number of looking strikeouts per count for Haren so far this season as shown below:
| Count | Number of looking strikeouts | Continuing plate appearances |
| 0-2 | 6 | 3.86 as 1-2 count |
| 1-2 | 4 | 2.57 as 2-2 count |
| 2-2 | 6 | 3.86 as 3-2 count |
| 3-2 | 2 | 1.29 as walk |
Using Haren’s career count splits, we can then calculate the expected results of a continued plate appearance. Here are Haren’s numbers following the adjustment:
| IP | K | K/9 | BB | BB/9 | HR | FIP | FIP- | xFIP | xFIP- | |
| 2014, Actual | 43.67 | 36 | 7.42 | 9 | 1.85 | 2 | 2.71 | 75 | 3.29 | 88 |
| 2014, Regressed | 42.24 | 27.91 | 5.95 | 11.63 | 2.48 | 2.21 | 3.34 | 92 | 3.94 | 109 |
The results of the adjusted numbers are not great for Haren. His K/9 rate drops from 7.42 to 5.95 (which would be the 20th lowest rate in baseball). Some of the changed plate appearances result in walks, increasing his BB/9 rate from 1.85 to 2.48.
As a result, Haren’s FIP increases from 2.71 to 3.34, which is still a bit better than league average (92 FIP-). Since Haren’s HR/FB ratio is currently half of the league average rate, his xFIP is higher than his FIP by a pretty significant margin. The adjusted plate appearances raise his xFIP from 3.29 to 3.94 and his xFIP- from 88 to 109. A 109 xFIP- is 9% worse than a league-average pitcher, and Haren hasn’t really shown that he will deviate much from the league-average HR/FB rate.
While the scaling method is simplistic, it does highlight the issue that Haren is having so far this year. The adjusted strikeout rate (15.1%) would put him in the upper section of the main cluster of data on the graph above.
Ultimately, if Haren wants to maintain his great strikeout rate and FIP (and ultimately ERA), he’ll need to get more batters to swing and miss. For his sake, hopefully that isn’t completely tied to his back problems and velocity drop, or else the future will be worth worrying about.