 Dodgers Digest Los Angeles Dodgers Baseball Blog
Brandon League has been one of the most unlikely success stories on the Dodgers this year. Not unlike Juan Uribe last year, he’s doing his best to make fans forget about previous terrible season(s) and a dubious contract. League has a 1.35 ERA and hasn’t given up an earned run since April 15th or any runs since May 1st, despite his best efforts on Friday night. Remember when we were mad that the Dodgers kept League over Seth Rosin (who currently has a 7.16 ERA and 4.43 FIP in 16 innings for the Lehigh Valley IronPigs)? ERA for relievers is terrible, but League’s peripherals are solid, too.
One of the biggest criticisms of League last year was that he wasn’t missing any bats. That’s still true this year; League’s swinging strike rate has actually gone down. As a result, League’s improvements have had to come from elsewhere. There are multiple areas with minor differences thus far:
Mechanics
Below is a GIF comparing League’s delivery from 2013 to 2014, played back at around 10% speed. Both pitches are sinkers to right-handed Marlins batters with the bases empty. On the left is Miguel Olivo (yes, him) in May 2013, and on the right is Adeiny Hechavarria in May 2014.
There are a few differences, but most of them are minor to the point of being almost inconsequential. The two halves of the GIF are synchronized to match at the release point. League starts earlier on the 2014 half, so his delivery is a bit slower this year. His glove doesn’t quite go as high when the hands separate and his leading foot points towards home plate slightly later. All of these things are changes which would have more impact on comfort than a direct impact on his pitches or on the hitters.
The only thing which might cause a more direct impact is League’s arm slot. His arm is a bit lower this year, and his elbow appears to stay back just a bit longer (though that could also be explained by slight differences in frame timing). The lowering of his release point can be verified by Brooks Baseball.
Movement
Here is a chart of vertical movement from Brooks:
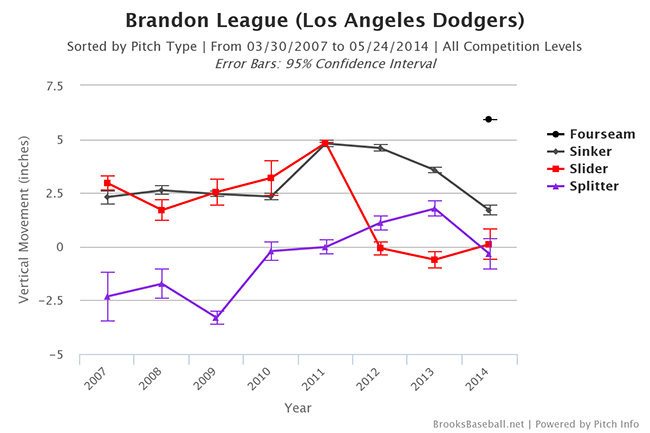
League has more “sink” this year than he did last year, potentially caused by the change in arm slot shown above. Somewhat surprisingly, League’s sink was greater in 2013 than it was in 2012, so more sink isn’t necessarily the only key to success.
Pitch Selection
League has nearly eliminated usage of his slider this year. Last year, batters hit .278/.316/.500 against the pitch. His sinker was worse, particularly in OBP, but the slider was League’s worst pitch in terms of power allowed. The slider’s Fangraphs pitch value was -0.58 runs above average per 100 pitches last year. The Fangraphs pitch value on his splitter was even worse, and he has significantly reduced his usage of that pitch as well.
Basically, League is throwing fewer secondary pitches this year, and his secondary pitches weren’t good to begin with.
Location
This might be the biggest change of all. Below is a comparison of the location of League’s sinker between 2013 and this year, thanks to the excellent Pitch FX database at Baseball Savant:
The difference is striking. Last year’s sinker was evenly distributed across most locations, but this year he’s almost completely avoided throwing the pitch up in the strike zone.
The pitch location for balls in play matters, too. If a non-strike is put into play, the result will be better than if a pitch in the zone is put into play. Last season, League allowed 203 balls to be put into play. 57 of these were located outside of the Pitch FX strike zone, a rate of 28%. This season, League has allowed 79 balls to be put into play, and 34 of these have been on balls out of the strike zone, a rate of 43%. This significant increase in non-strike balls in play can help explain better results when League still isn’t missing bats.
Batted Balls
Here is a comparison of League’s batted ball distribution between last year and this year:
| LD% | GB% | FB% | IFFB% | HR/FB% | IFH% | |
|---|---|---|---|---|---|---|
| 2013 | 19.1% | 59.8% | 21.1% | 2.4% | 19.0% | 14.3% |
| 2014 (as of 5/24) | 11.8% | 75.0% | 13.2% | 20.0% | 0.0% | 7.0% |
Everything has moved in the right direction. Line drives are way down and fly balls are down significantly as well. His ground ball rate has increased dramatically as a result, which is what you want for somebody who doesn’t miss many bats. He hasn’t allowed any home runs so far (before this season I noted that League’s HR/FB rate was anomalously high last year). Even the number of infield hits has gone down and pop fly percentage has gone up.
League will allow a homer eventually, but the location difference noted above should help. He’s only allowed 10 fly balls so far this year, so even the “league average” HR/FB rate would be one homer allowed. As a result, there isn’t a big gap between League’s FIP and xFIP.
—
Results
All of these changes have worked out so far. League’s 1.35 ERA won’t be sustained all season, but he’s backing it up with a 2.76 FIP compared to last year’s sky-high 4.93, which was near the bottom of the league. After adjusting for HR/FB rate, League’s xFIP this year is 3.25, significantly lower than last year’s 4.07. Even his 2.48 SIERA is much better than the 3.67 SIERA he produced last season.
Given all of the changes and differences above, there’s a surprising amount of hope for League going forward. The differences point to more than just small sample luck, or at least as much as possible with 26-2/3 innings of work. In a vacuum, I don’t know if I’d put League back into the late innings, but it’s hard to come up with any better alternate plans with the way things are going so far this year. At least it’s a fun story, and with nearly the entire bullpen being disappointing in one way or another, the fun story is more than welcome.