It’s no secret that the Dodger rotation needs help. Mike outlined the need for a pitcher last week. The names to dream on are Max Scherzer, Jon Lester, and to an extent, James Shields. However, it’s unknown if the team has that kind of money to spend on pitching (or if they’d prefer to shell out the money in other areas, hi Russell Martin). Given the strength of the rotation as-is, it might make sense to complete it with back end type starters.
That’s where Brandon McCarthy comes in. You probably know him more for his plus-plus twitter account, but the season he completed makes him an intriguing free agent target. He started 2014 in Arizona, and struggled on the surface. He posted a 5.01 ERA (131 ERA-), which led to a sub-replacement RA9 value. His FIP was better, at 3.82 (99 FIP-, or almost precisely league average), and his xFIP was a sterling 2.88 (78 xFIP-). His biggest issues in Arizona were a nightmarish .345 BABIP and 20% HR/FB ratio.
After 109 innings, McCarthy was traded to the Yankees, who were desperate for quality starting pitching. They were, essentially, betting on his xFIP. That bet paid off, and McCarthy was one of the reasons why they were still in playoff contention until the last week of the season. In his 91 innings in the Bronx his ERA improved dramatically, to 2.89 (74 ERA-). His FIP also went down significantly, to 3.22 (83 FIP-). At the same time, his xFIP was almost exactly the same before and after the trade. On the surface, his run prevention regressed to his deepest peripherals.
In order to see if McCarthy is a viable target, or if his time in Arizona should be viewed as a warning sign, we need to answer three questions:
- Why was his xFIP so good?
- Why did he have a home run problem?
- Why the improvement in New York?
xFIP
The components which go into xFIP are strikeouts, walks, and fly balls. Let’s look at this piece by piece.
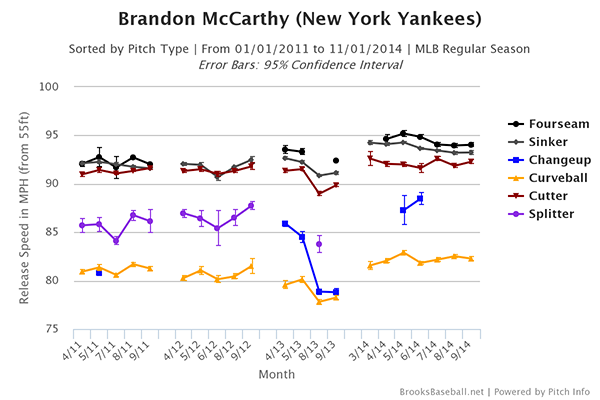
McCarthy increased his strikeouts dramatically last year. His career strikeout rate is 6.35 K/9, but last year it jumped to 7.88. The primary reason behind the strikeout increase is pretty obvious:
McCarthy has changed his pitch mix over the years, but in 2014 all of his pitches were 1-3 mph faster than his previous career highs. The increased velocity led to an increase in swinging strike rate, from 7.6% career and 5.9% in 2013 to 8.8% in 2014. The league average rate is 9.4%, so McCarthy is still a bit lower, but with his walk rate that’s still all he needs.
The decrease in walks is a bit trickier to explain. McCarthy walked 1.49 batters per nine this year, compared to a career rate of 2.23. This is, paradoxically, accompanied by a zone rate of 50%, close to his career low. However, his first pitch strike rate (67.5%) was within a few tenths of his career best and batters swung at pitches out of the zone more than ever before.
Finally, the fly balls. In 2014, McCarthy had a career low fly ball rate of 24.7% and a career high ground ball rate of 52.6%. When looking at his pitch locations, it’s pretty easy to see why.
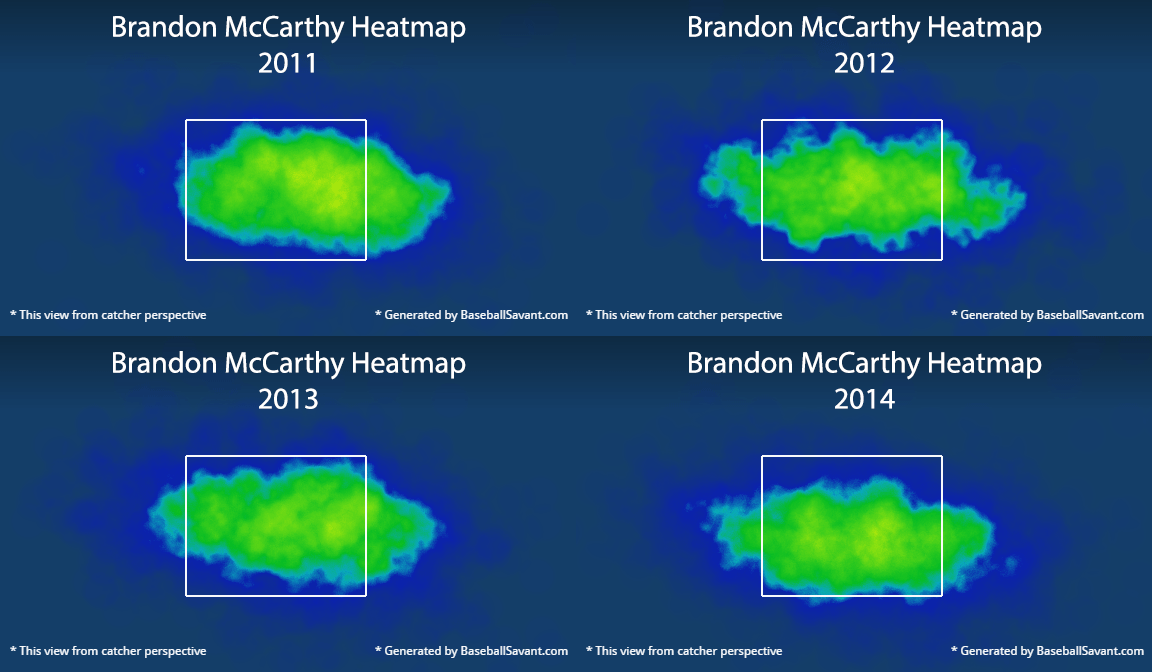
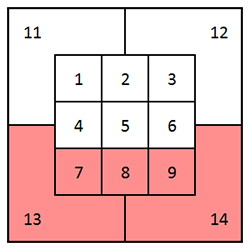
There’s a pretty clear shift downward in the 2014 frame, and there’s an even more dramatic way to look at it. Baseball savant breaks pitch location down into 14 zones, as shown below. The table to the right shows the percentage of pitches McCarthy has thrown into the highlighted zones. Throwing pitches in these areas can result in more grounders, and also reaps some benefits from the current lowering strike zone.
| Year | Percent |
|---|---|
| 2011 | 42.9 |
| 2012 | 43.0 |
| 2013 | 40.9 |
| 2014 | 56.4 |
McCarthy targeted this area significantly more often this season, and the results speak for themselves. His ground ball rate was 14th in among major league starters (incidentally, one spot ahead of Clayton Kershaw), and his ground ball to fly ball ratio was sixth. Limiting fly balls allows the “expected home runs” component of xFIP to be lower, which is yet another reason why McCarthy posted the ninth best park-adjusted xFIP in all of baseball last season.
Home runs
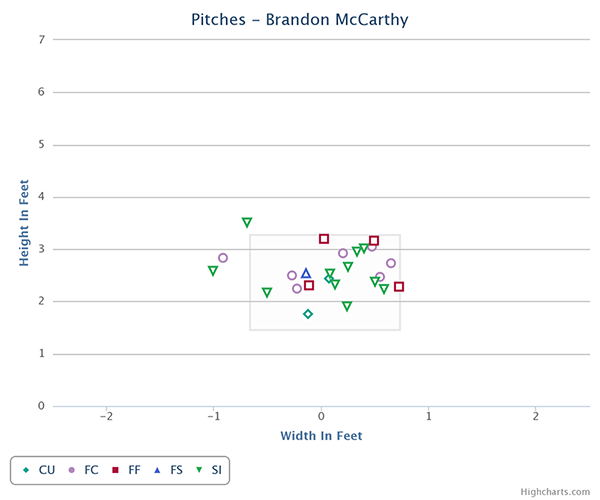
Of course, xFIP alone is not the way to judge a pitcher. McCarthy had a real home run problem last season, especially with Arizona. Here are the pitches and locations of all of them:
There are a lot of high cutters and sinkers in there, and a sprinkling of other pitches as well. It’s a good thing that McCarthy pitched as low in the zone as he often did. 19 of the 25 home runs he allowed last season were not in the highlighted zones in the earlier pitch fx chart (upper 2/3 of the zone and high balls). When McCarthy missed up in 2014, the pitch turned into a home run 1.5% of the time.
McCarthy’s HR/FB ratio was 16.3% in 2014, compared to a league average rate of 9.5%. That’s why his 3.55 FIP was significantly higher than his 2.87 xFIP. However, batted ball distance paints a slightly better picture. The average distance on fly balls McCarthy allowed in 2014 was 287 feet, with a standard deviation of 58.5 feet. This results in an average + 1.5 stdev fly ball distance (basically, top 10%) of 375 feet. Using this correlation tool, this results in an “expected” HR/FB ratio of 12.4%, much closer to the league average.This also indicates that an expected FIP might be better positioned about halfway between McCarthy’s FIP and xFIP, which would still be better than league average.
Improvement
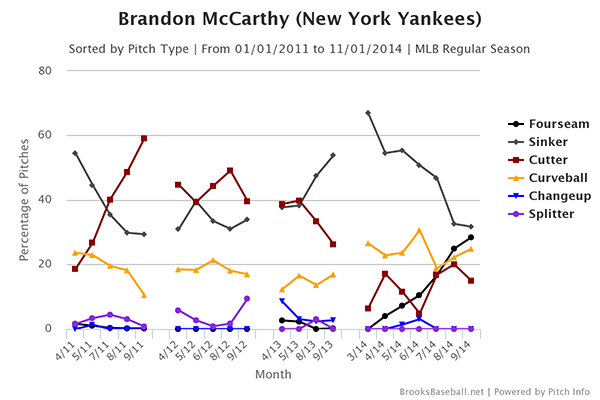
The biggest change between McCarthy as a Diamondback and McCarthy as a Yankee was pitch selection:
McCarthy made one start in July with the Diamondbacks, and you can see that he started to taper off his sinker use and replace it with cutters and four seam fastballs. McCarthy explained why in August:
In Arizona, the staff wanted him to trim his pitch selection. So he tended to favor his out pitch, or get “sinker happy,” as he said. “There are places that have philosophies and they like to try and and get guys to do certain things,” McCarthy said. While he was never directly told to stop throwing his cutter and four-seamer, McCarthy said, it became clear they wanted him to stick with his sinker.
The Yankees went in a different direction. McCarthy said when he was acquired by the Yankees they told him they traded for the pitcher they had seen … in Oakland. “It was exciting when I got here and they said, ‘We want you to start throwing the cutter more,'” McCarthy said.
The Diamondbacks are kind of the best, aren’t they? The change made a lot of sense, especially when you look at the home run chart above. McCarthy allowed 11 home runs on sinkers last season, and its fangraphs pitch value was -10 runs. His cutter was still punished every once in awhile (7 home runs), but its fangraphs pitch value was just about league average, partially because it was the fifth fastest among all major league starters last season.
The trend towards the four seam fastball being used more often started in Arizona, but it continued in New York. Again, McCarthy went to a pitch which worked better; Fangraphs had the pitch at roughly league average as well. The way McCarthy threw his fastball was “backwards.” In Arizona, he used his four seam fastball with two strikes on a hitter 25% of the time against lefties and 16% of the time against right-handed batters. In New York, those percentages increased to 37% and 29%, respectively. McCarthy’s four seam fastball was the fourth best at generating whiffs when a batter swung at it last season, and it was one of the reasons why his strikeout rate increased from 20% to 22% after the trade, which made up for the slight decrease in grounders and kept the xFIP constant.
The two biggest numerical changes for McCarthy after he was traded, partially due to the different pitch arsenal described above, were regressions in his BABIP and HR/FB. His BABIP with the Diamondbacks was .345, possibly sustainable by the league’s best hitters but generally well beyond what a pitcher will allow with a large sample. His HR/FB ratio also fell significantly, from 20% to 12.8%. The lower HR/FB rate in New York almost precisely matches what the earlier calculation says his ratio should have been, which is extremely encouraging.
Put all of this together, and it means that McCarthy’s 83 FIP- in New York wasn’t entirely luck. His 74 ERA- had a lot to do with an unsustainably high strand rate, but the smart change in repertoire and regression of numbers which are commonly more variable in small samples point to positive things.
So, should the Dodgers sign him?
Everything I listed above sounds pretty good, so yes, the Dodgers should try to sign him. There are a couple of caveats, though. The first is McCarthy’s previous injury history, which would best be described as “scary.” He pitched precisely 200 innings last season, but only surpassed 120 innings twice before that. Below is a table using the injury data at Baseball Prospectus. Ignoring freak accidents like the line drive which McCarthy took to his head in 2012, here are his last few seasons:
| Year | Injury | Games missed |
|---|---|---|
| 2013 | Right Shoulder Soreness | 55 |
| 2012 | Right Shoulder Strain | 43 |
| 2012 | Right Shoulder Soreness | 9 |
| 2012 | Right Shoulder Strain | 13 |
| 2012 | Right Shoulder Soreness | 7 |
| 2011 | Right Shoulder Stress Fracture | 41 |
| 2010 | Right Shoulder Stress Fracture | 61 |
| 2009 | Right Shoulder Stress Fracture | 77 |
Yikes. McCarthy wasn’t able to stay on the field until last season. McCarthy credited improved shoulder workouts for keeping him healthy, and it also could explain why he was near his career high in velocity in his age 31 season. Still, the injury history should play into contract negotiations. If the Dodgers can get McCarthy to sign for two years, they should jump on it immediately. Three years should cause some hesitation, and four years should be out of the question.
McCarthy probably won’t ever live up to the upside which his xFIP showed last season. That upside would be better than any other pitcher on the market. However, there is ample evidence that his ERA in Arizona was a fluke. At worst, he’s a league average starter, as he has been for most of his career, and he could be even better. That’s exactly what the Dodgers need.
 Dodgers Digest Los Angeles Dodgers Baseball Blog
