 Dodgers Digest Los Angeles Dodgers Baseball Blog
The drop in offense in MLB is a wide topic of discussion. Across baseball, teams scored an average of 4.07 runs per game in 2014, the lowest level since 1981. While some don’t necessarily mind the decline (myself included), new commissioner Rob Manfred seems to be interested in increasing offense to make baseball appealing to a larger audience. This started out poorly, as Manfred mentioned being open to banning defensive shifts, though he has since backed off the idea.
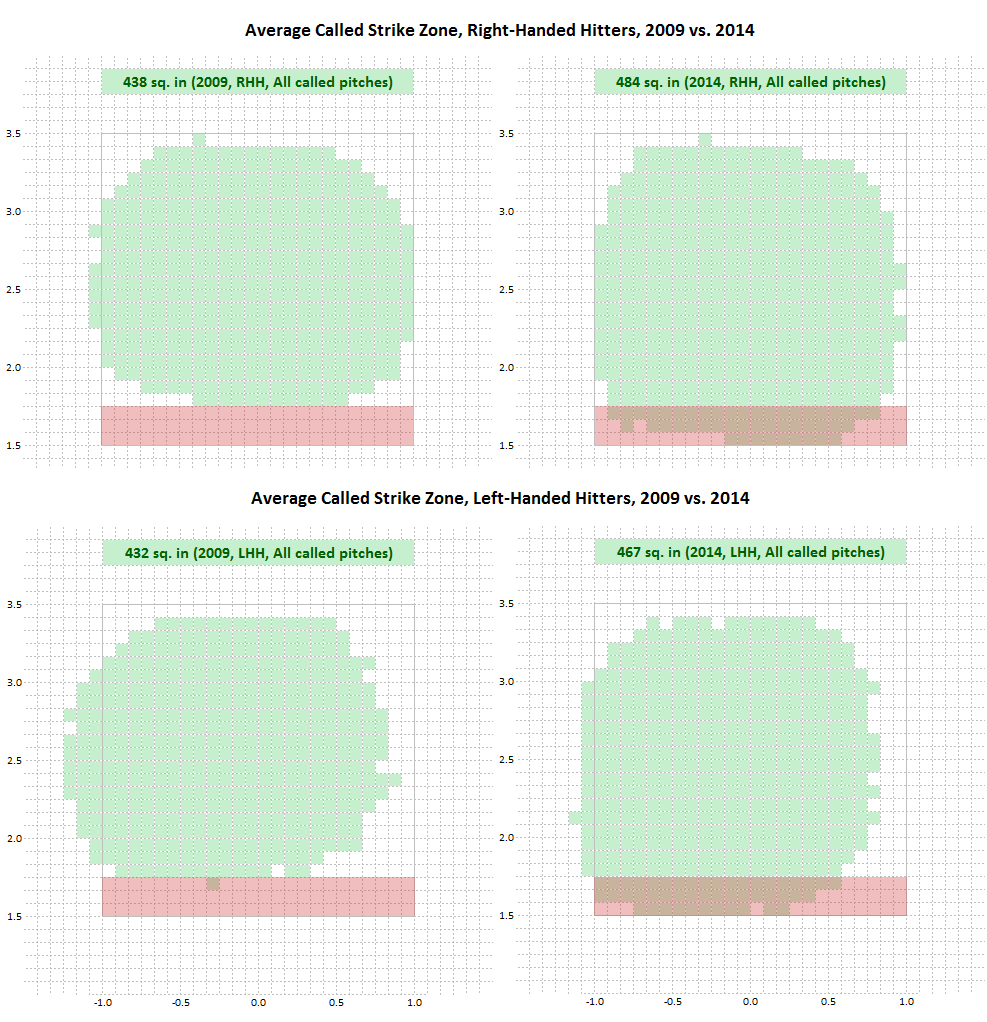
Banning shifts would be silly, as there is evidence that the recent increase in defensive shifts hasn’t necessarily corresponded to the drop in offense. Besides, there are easier targets to increase run scoring; Pitch FX has allowed us to note that the strike zone is expanding quickly. In this fantastic piece, Jon Roegele found that the strike zone has grown from 435 square inches in 2009 to 475 square inches last year. A bigger strike zone means fewer runs.
Roegele’s analysis shows that the majority of the strike zone enlargement has occurred at the knees. In 2009, the average strike zone had no area lower than 21 inches off the ground. In 2014, the average strike zone contained 47 square inches lower than 21 inches from the ground. Roegele then found that pitchers responded to the changing zone by throwing more low pitches, and batters responded by swinging at low pitches more often. When analyzing the topic a year earlier, Roegele found that the strike zone changes were responsible for roughly 1/3 of the drop in run scoring. Another analysis by Brian Mills of the University of Florida in 2013 concluded that the strike zone expansion was responsible for 24-41% of the drop in offense. The changing strike zone isn’t the only cause of the recently quiet bats, but it is a significant one, and perhaps the easiest thing to fix.
Analyses like these make it no surprise that Major League Baseball is looking into altering the size of the strike zone, according to a recent report by Jeff Passan. The article states that action won’t be taken in the 2015 season, but could take place next year if the current trends continue. This got commenter BlueMarvin thinking (and then me, after the question was raised): which Dodgers are currently using the expanded zone the most?
The figure below describes the “expanded zone.” The strike zone size plot (green) was generated by Jon Roegele and shows the average zone in 2009 and 2014. The red box I drew is the area of highest interest since it is where the strike zone is most likely to change. Specifically, these are pitches over the plate and between 18 and 21 inches off the ground:
Before getting into the specific numbers, it’s important to remember that a pitcher throwing into the highlighted zone isn’t necessarily a bad thing. They could see a few more pitches called as balls if MLB changes the strike zone, but that’s also where ground balls are generated. The numbers below also include all pitches, but some pitch types will be more impacted than others. The relationship is too complicated to say “pitchers who throw into this area a lot will suffer disproportionately” but at least it gives us a look at who might need to adjust more than others.
First, let’s look at who actually throws into that highlighted zone. Below is a table with every pitcher projected to throw over 25 innings for the Dodgers in 2015 per FanGraphs’ depth charts. Using Baseball Savant‘s searchable database, the number of pitches each pitcher threw into the zone of interest in 2014 is easy to find. The average MLB rate is included as a reference. Pitchers highlighted in green threw into the highlighted zone less than average, while pitchers highlighted in red threw there more often than average.
| Pitches in range | Total pitches | Percentage | |
|---|---|---|---|
| MLB Average | 44965 | 704663 | 6.38% |
| Clayton Kershaw | 164 | 2722 | 6.02% |
| Zack Greinke | 189 | 3210 | 5.89% |
| Hyun-jin Ryu | 127 | 2443 | 5.20% |
| Brandon McCarthy | 244 | 3044 | 8.02% |
| Brett Anderson | 46 | 663 | 6.94% |
| Kenley Jansen | 59 | 1061 | 5.56% |
| J.P. Howell | 59 | 809 | 7.29% |
| Joel Peralta | 64 | 1091 | 5.87% |
| Brandon League | 101 | 957 | 10.55% |
| Juan Nicasio | 88 | 1616 | 5.45% |
| Chris Hatcher | 67 | 924 | 7.25% |
| Yimi Garcia | 11 | 134 | 8.21% |
| Paco Rodriguez | 18 | 235 | 7.66% |
| Pedro Baez | 19 | 351 | 5.41% |
The Dodgers’ top three starters all throw into the lowered strike zone area less often than average. Ryu is particularly adverse to throwing in that area since he throws low pitches less often than most starters in baseball. McCarthy is the highest above the average among Dodger starters, which isn’t surprising since he depends on ground balls. The relievers are impacted a bit more than starters. League throws into the area of interest particularly often (third highest rate in baseball among pitchers with at least 750 pitches thrown last year), though it is unlikely that he would still be a Dodger when any rule change would go into effect. Many of the middle relievers throw into the area of interest frequently, though there are some sample size issues for the last three pitchers on the table.
Using the projected innings total for each pitcher to create a weighted average, and assuming no change in frequency next year, Dodger pitchers “will” throw into the low strike zone area 6.52% of the time, slightly above the major league average. By comparison, in 2009 major league pitchers threw into the low strike area 5.42% of the time.
Roegele’s analysis showed that pitchers threw into the low strike area more often and batters swung more often, but the change would have a big impact when batters take those pitches, since some called strikes would change to balls. Taken pitches in the highlighted area were called as balls 78.5% of the time in 2009 and just 43.6% of the time in 2014.
Unfortunately looking at just called strikes for the Dodger pitchers wouldn’t be sufficient on its own, because it doesn’t isolate for framing. Instead, we’ll just look at the percentage of pitches taken in the low strike zone area and assume that there would be a change in average results if framing is constant.
| Taken pitches in range | Total pitches | Percentage | |
|---|---|---|---|
| MLB Average | 20817 | 704663 | 2.95% |
| Clayton Kershaw | 75 | 2722 | 2.76% |
| Zack Greinke | 96 | 3210 | 2.99% |
| Hyun-jin Ryu | 63 | 2443 | 2.58% |
| Brandon McCarthy | 111 | 3044 | 3.65% |
| Brett Anderson | 19 | 663 | 2.87% |
| Kenley Jansen | 36 | 1061 | 3.39% |
| J.P. Howell | 16 | 809 | 1.98% |
| Joel Peralta | 28 | 1091 | 2.57% |
| Brandon League | 45 | 957 | 4.70% |
| Juan Nicasio | 44 | 1616 | 2.72% |
| Chris Hatcher | 39 | 924 | 4.22% |
| Yimi Garcia | 4 | 134 | 2.99% |
| Paco Rodriguez | 10 | 235 | 4.26% |
| Pedro Baez | 10 | 351 | 2.85% |
Most pitchers remain on the same side of average as before, with a few exceptions. When looking at taken pitches only, Greinke was above the league average last year, but barely. Anderson was above average for pitches thrown into the low strike area, but below average for pitches taken there. J.P. Howell saw the same effect as Anderson, to a more extreme degree. The weighted average of Dodger pitchers’ low zone take rates is 3.03%. Like the overall usage rate, this is very slightly above the league average.
The pitcher who saw the biggest change when looking at taken pitches in the low strike zone, compared to total pitches thrown in the same area, was Kenley Jansen. Jansen threw 59 of 1061 pitches into the low strike area, which was below the league average rate. However, 36 of those pitches were taken. After all, what is a batter going to do with a 95mph cutter at the knees? That take rate was above the league average, so Jansen would theoretically be impacted by a higher strike zone more than most.
Again, I would caution readers not to read too much into the results of this quick study. The strike zone might shrink in 2016, but the Dodgers also just switched their primary starting catcher from one of the worst pitch framers in 2014 (A.J. Ellis) to one of the best (Yasmani Grandal), which would increase the size of the Dodger strike zone in relation to league average. It is something interesting to think about, though. There’s no easy answer to how Dodger pitchers will adjust to such a change, or if they should even adjust at all. In the meantime, we can think about more run scoring as pitchers and catchers start to report.