 Dodgers Digest Los Angeles Dodgers Baseball Blog
Note: All data used in this is prior to the 4/15 win against Arizona. The only real change would be Clayton Kershaw for his gem, Chris Taylor with a double and home run, and Cody Bellinger, who also added two hits. Other changes in the data from now until the time you read this are likely minimal.
The Dodgers won their fifth game of the season yesterday behind a vintage-looking Clayton Kershaw. The offense put up seven runs, and for a brief moment, the team was finally good again. Through the first two weeks of the season, a handful of guys on the team are underperforming expectations. That is how you end up at 5-9 anyways. Granted, the team has been without Justin Turner and somewhat without Kenley Jansen, but even without them it’s reasonable to expect better performances than we have seen until this point. Certain players have outperformed their expected outcomes on the mound and at the plate and some … haven’t. To look at all the individual hitters, I’m going to use their expected weighted on-base average (xwOBA), which is based off of launch angle and exit velocity. For the pitchers, I’m going to use fielding independent pitching, and their expected fielding independent pitching, both of which I’ll explain in detail later.
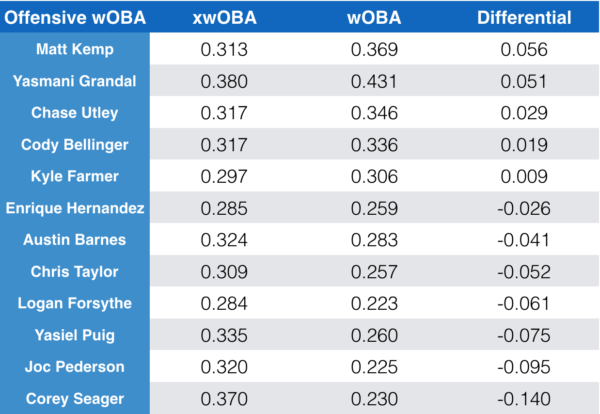
To give you a better idea of where these guys sit, league-average wOBA is .314 so far, and was .321 last year.
One of the most important things to note here is the xwOBA. While it is nice to see that Enrique Hernandez and Logan Forsythe are both under their expected outcomes as you could expect this to turn around, their actual expected outcomes are both below league-average in the first place. While guys like Matt Kemp, Bellinger, and Chase Utley are outperforming their expected outcomes, their expected outcomes are all solid for if/when they do take a small step back. Yasmani Grandal is also outperforming, but even still his xwOBA of .380 is elite. Last year, Bellinger posted a wOBA of .380 which was good for 21st in baseball. The biggest discrepancy here in offensive struggle comes from some key players severely underperforming based on their batted ball numbers. Corey Seager, Joc Pederson, and Yasiel Puig are all top five on the team based on expected outcome, but all bottom five in actual performance. I wrote about Puig recently, and it appears as if he’s starting to turn things around now. Seager’s differential of -0.140 is the sixth largest discrepancy in the league. Just to understand the offensive struggles have been congruent, Kershaw is currently underperforming his xwOBA of .228 by posting an actual of .175.
——
From the FanGraphs pitching glossary:
Fielding Independent Pitching (FIP) measures what a players ERA would look like over a given period of time if the pitcher were to have experienced league average results on balls in play and league average timing…a better way to assess a pitchers talent level is by looking at results a pitcher can control directly: strikeouts, walks, hit by pitches, and home runs.
FIP is an attempt to isolate everything a pitcher has control over. Therefore, the best pitchers have a low FIP. It’s formulated in such a way to make it essentially an ERA predictor. Chris Sale led the league in FIP last year at 2.45, while Kershaw was sixth at 3.07.
Expected Fielding Independent Pitching (xFIP) is a regressed version of Fielding Independent Pitching (FIP). It’s calculated in the same way as FIP, except it replaces a pitchers home run total with an estimate of how many home runs they should have allowed given the number of fly balls they surrendered while assuming a league average home run to fly ball percentage.
xFIP is an expected version of that based on league-average home run/fly ball rate. Early on, pitchers that have given up an excessive amount of home runs benefit from xFIP, and pitchers who haven’t allowed a home run yet are hurt. While it is good to see someone like Jansen who looks to come back to norm as he has a large discrepancy between expected and actual performance — it’s better to post a very low xFIP like Tony Cingrani in the first place.
For context before these next two charts, the league-average xFIP and FIP last year was 4.36, this year it’s off to a low start at 3.93.
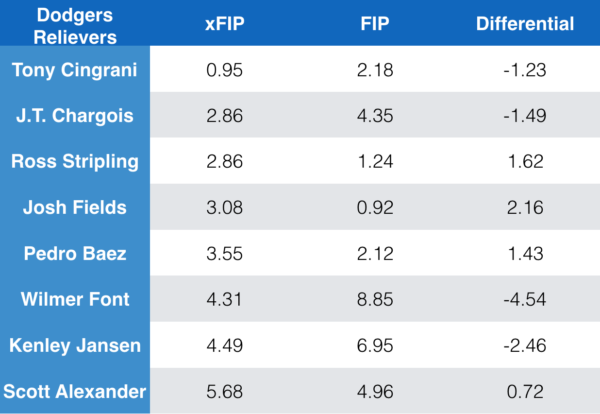
The noteworthy guys here are Cingrani, JT Chargois, Ross Stripling, and Josh Fields. Cingrani and Chargois have both underperformed and Stripling and Fields have both over performed, at least based on xFIP. That’s all fine, as they’re all posting well below league-average xFIP numbers in the first place.
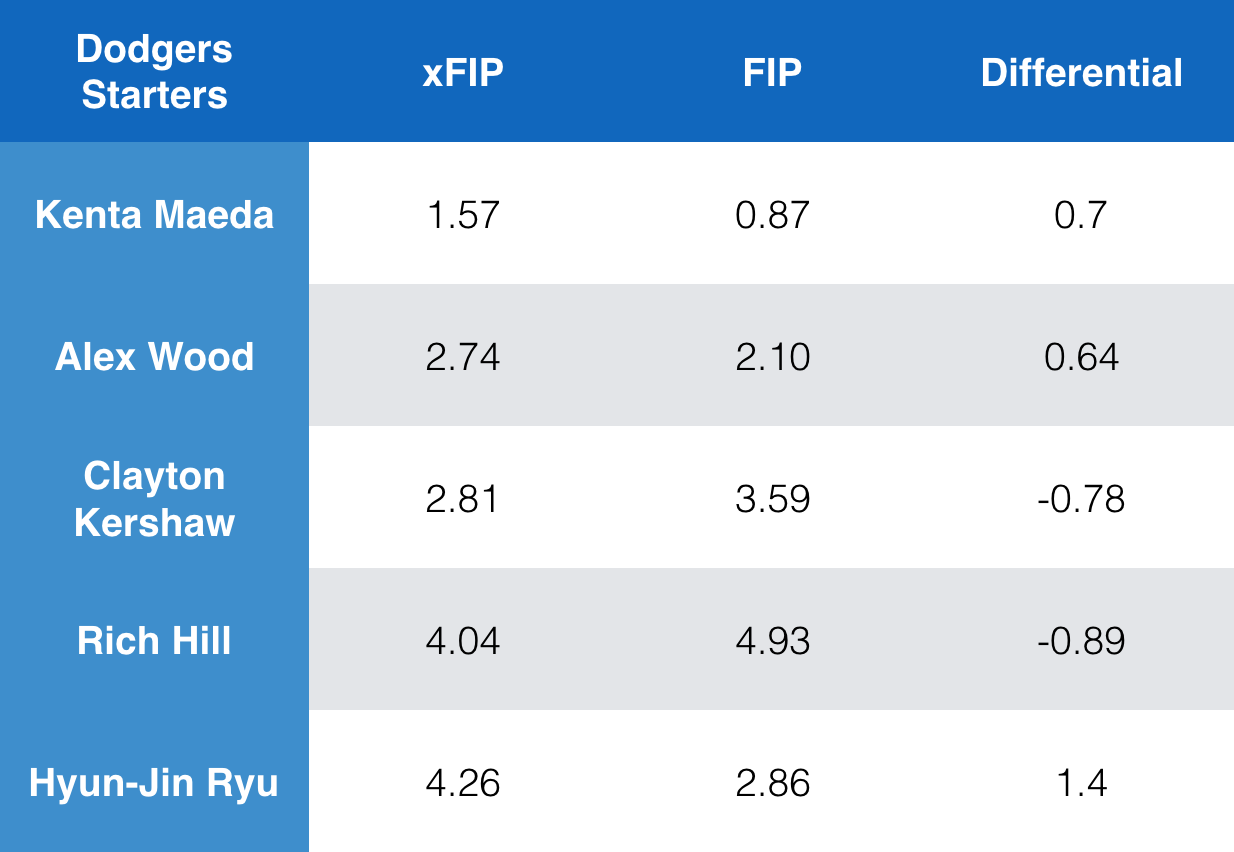
Kenta Maeda and Hyun-Jin Ryu look strong here as they both haven’t given up a home run yet, while Alex Wood has only given up one. Kershaw’s numbers will drop after his strong outing on Sunday, but he’s now up to four home runs allowed. There is likely some noise in the pitching numbers, but that is unavoidable looking at this just two weeks into the season. Maeda only has 8.2 innings pitched, Ryu 9.2, while Wood and Hill are both coming off terrible outings. These things will probably work themselves out into more usable and stable numbers in just a few weeks and we’ll look at them again then.
Similarly, the offense will probably have worked itself out by then as there are some large discrepancies in performance. The bullpen has performed very well outside of Wilmer Font, Jansen, and Scott Alexander and that looks to bode well. It makes sense to expect a more well-rounded Dodgers team as a whole moving forward.