Clearly I’m biased, but I would have voted for Clayton Kershaw to win MVP. Shocking, right? I won’t go through the entire exercise of creating a full mock ballot (though, without a ton of thought, I’d probably go Kershaw-Cutch-Lucroy-Rendon-Stanton for the top five), but the distance between Kershaw and Andrew McCutchen would be very narrow. McCutchen was only half a win or so behind Kershaw in WAR, depending on your preferred metric. That’s well within the margin of error, and I’m not sold on McCutchen’s defensive metrics being down so significantly from last season.
One defense you hear for pitchers winning the MVP is comparing their total number of batters faced to a position player’s total number of plate appearances. McCutchen had 648 plate appearances last season, and Kershaw faced 749 batters. This isn’t perfect, though, for a number of reasons. First, part of a pitcher’s run prevention gets credited to the defense. Second, the position player makes a significantly higher impact on defense than a pitcher.
This sounds like it would tip the scales towards McCutchen for me, but there’s one big factor in Kershaw’s favor which breaks the effective tie for me. He bats. And, really, how many pitchers can do the thing Kershaw did at the end of this video?
That adds value, too. In 2014, Kershaw hit .175/.235/.206 (29 wRC+). That’s a bit worse than what he managed last season, but the league average pitcher hit a paltry .122/.153/.153 (-19 wRC+). Kershaw’s 74 plate appearances of not being a complete pit at the bottom of the lineup have value, too. Fangraphs has that value at 0.4 wins, and Baseball Reference has it at 0.5. In a crowded race, that value cannot be ignored (though it often is). In my mind, it serves as a tiebreaker, and why I thought Kershaw was the clear winner.
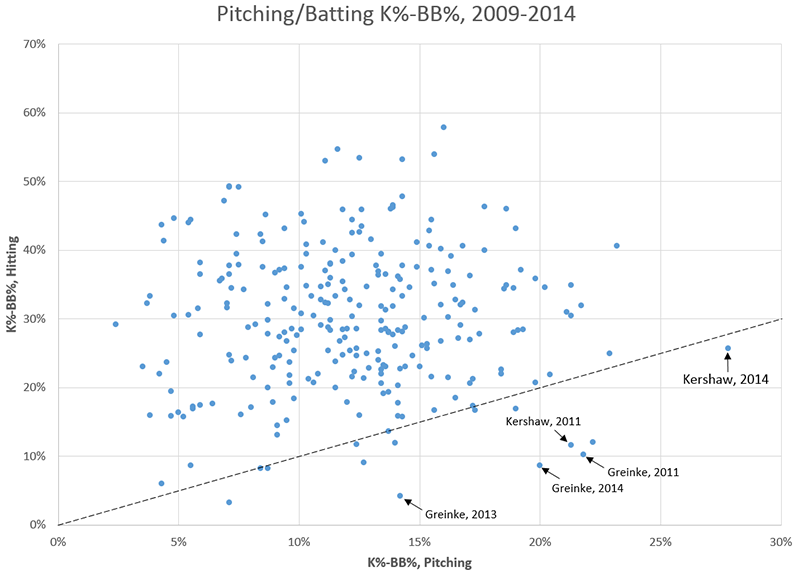
Kershaw being competent with the bat also provides us with some fun facts. Famously, his OBP allowed (.231) was lower than what he had as a batter (.235). Those fun facts can be taken a bit further, though. In 2014, Kershaw had a K%-BB% (while pitching) of 27.8%, the fifth highest mark of all time and the best since Curt Schilling did the same in 2002. While batting, Kershaw had a K%-BB% of 25.7%, lower than his pitching total.
I wanted to see how rare this is, which produced the following chart. Every point on the graph below is a pitching season where the pitcher qualified for the ERA title and made at least 50 plate appearances. I only used data since 2009 since producing the plot involved a fair amount of manual spreadsheet work. The black dashed line has a slope of 1, so if a pitcher is below it he had a better K%-BB% while batting than what batters had against him. It’s giving equivalency to non-equivalent results, but it’s meant to be fun rather than instructive.
In the five year sample, there are 270 pitching seasons which qualified. In 15 of them, a pitcher fell below the line. Kershaw is obvious, all by himself on the right. Five times, a pitcher has fallen below the line while having a pitching K%-BB% >=20%. Kershaw did that this year, obviously, but he also did it in 2011 (and missed by 0.9% last year). Zack Greinke has also done it in 2011 and 2014 (also, note the fun point from last year), because of course he has. As an aside, there were four seasons in which a pitcher’s K%-BB% was 10% lower while batting than while pitching, and Greinke has three of them. The other was Javier Vazquez in 2009.
The value Kershaw provides on defense gets included in the run prevention value metrics like Baseball Reference WAR and Fangraphs’ RA9-WAR. However, the value Kershaw provides with the bat over the typical pitcher hitter is not. Pitchers are hitting worse in comparison to the rest of the league than they ever have before. The value of a pitcher hitting well should not be ignored, and is yet another reason why Kershaw was an incredibly deserving MVP.
 Dodgers Digest Los Angeles Dodgers Baseball Blog
