The Dodgers’ current starting rotation is shaping up to be one of the strongest in the league. Clayton Kershaw, Zack Greinke, Hyun-Jin Ryu, Dan Haren, and Josh Beckett is a combination that most teams in the league envy for their pitching ability. The Dodgers’ projected rotation has a hidden talent, though: they can hit. I’m not talking about sacrifice bunting, either. That’s boring. When compared to other pitchers, they can do more than that.
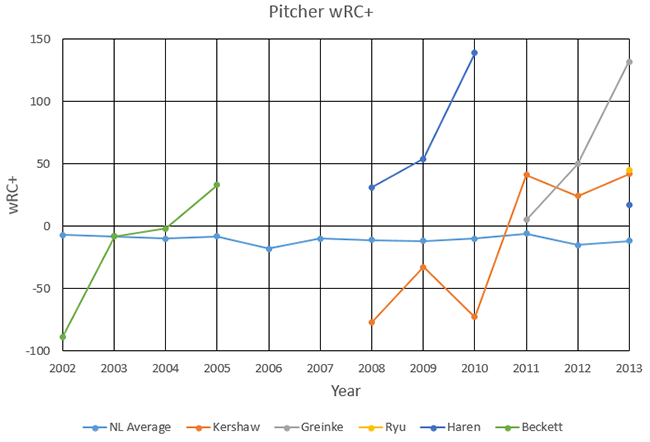
The graph below shows each of the projected starting five in terms of wRC+ (minimum 35 plate appearances) by season. The average wRC+ for a position player is 100, and the average wRC+ for NL pitchers is the light blue line. 
The graph shows that all of the Dodgers’ starting five is consistently better than the average pitcher with the bat. Let’s break this down pitcher-by-pitcher:
Clayton Kershaw
Best season: 2013. 92 PA, .182/.241/.260, 42 wRC+, 0.6 oWAR
Career: 424 PA, .154/.192/.175, -3 wRC+, 0.8 oWAR
Best moment: 4-1-13 Opening Day HR
An easy choice. We’re not going to forget this moment for a long time.
Conclusion: Kershaw struggled with the bat during his first three years in the majors, hitting just .076/.103/.076 in his first 171 plate appearances. However, he’s improved his hitting line to .204/.247/.238 in his last 253 plate appearances. He’s been consistently competent with the bat over the last three seasons, and there is no reason to think that this won’t continue in 2014.
Zack Greinke
Best Season: 2013. 72 PA, .328/.409/.379, 132 wRC+, 1.3 oWAR
Career: 195 PA, .226/.273/.329, 64 wRC+, 1.8 oWAR
Best moment: Home run, 7-24-12
It was hard to chose this over Greinke’s RBI single in game 5 of the 2013 NLCS, but there’s a few critical things to note:
- That bat flip. Easy 70-grade.
- Cliff Lee was pitching.
- It traveled 392 feet. Not exactly a cheap shot!
Conclusion: Greinke wasn’t just a good hitting pitcher last season, he was a good hitter by any definition. His 132 wRC+ from last season matched Carlos Beltran‘s (in fewer plate appearances, obviously). It was the fourth best pitcher hitting season by wRC+ since 1970 (min 50 PA).
Even before last year, Greinke has shown some success with his bat. He hit a home run in his fourth major league plate appearance (as a Royal, against the Diamondbacks in interleague play). He most likely won’t be as good next season as he was in 2013, but he’s still a decent bet to add some value.
Hyun-Jin Ryu
Career: 66 PA, .207/.233/.293, 45 wRC+, 0.4 oWAR
Best moment: Triple, 6-12-13.
Really, what else could it be?
Bonus: Bat flip double, 8-30-13.
80-grade. He must be learning from Puig. This ball was pretty close to going out.
Conclusion: Ryu didn’t hit regularly in Korea, but he was excellent with the bat in his rookie season. He did cool off a bit as the season went on, hitting only .174/.208/.261 after May 1st. Even the lower batting line is above average for pitchers, so if he can maintain that next season the Dodgers will be happy.
Dan Haren
Best Season: 2010. 57 PA, .364/.375/.527, 139 wRC+, 1.1 oWAR
Career: 353 PA, .215/.240/.312, 38 wRC+, 2.2 oWAR
Best moment: Home run, 6-28-10.
A first row shot, but almost to dead-center. It looks a bit similar to Kershaw’s HR, except to the opposite field. This is another home run against a good pitcher (Chris Carpenter this time).
Conclusion: Zack Greinke was ridiculously good in 2013, but Dan Haren was even better in 2010. His wRC+ of 139 was the third best by a pitcher since 1970. Unfortunately, he was traded to the Angels at the deadline and his amazing hitting season was cut short.
2013 was Haren’s first season back in the National League, and he wasn’t nearly as good as he was in 2010. He managed a .170/.204/.234 line (17 wRC+), still above the pitcher average. Hopefully, his performance last season was more due to rust, and he can work back towards his 2010 season in a Dodgers uniform.
Josh Beckett
Best season: 2005. 71 PA, .153/.239/.254, 33 wRC+, 0.3 oWAR
Career: 292 PA, .136/.172/.208, -4 wRC+, 0.2 oWAR
Best moment: Home run, 6-14-09
Beckett has hit 3 home runs in his career, 2 of which were against the Phillies. Unfortunately, the other two career home runs are before mlb.tv archives begin. At least this homer wasn’t cheap. The Phillies announcers did call him Mike Lowell, though.
Conclusion: Beckett’s had some good hitting moments, but his career numbers aren’t very impressive. In 29 plate appearances since joining the Dodgers, he’s hitting .042/.080/.042 in 29 plate appearances. He’s the biggest question mark in the rotation due to his shoulder injury, but he’s also the biggest question mark with his bat.
—
Overall:
Last season, the Dodgers pitching staff hit .177/.237/.229, by far the best line among national league teams. That performance was good enough for an overall wRC+ of 33, the fourth highest by a national league team since 1990. Last season, Dodgers pitchers had a collective wRAA (weighted runs above average) of -28.0. The average national league team had -42.7 wRAA. The offensive output of Dodgers staff was 14.7 runs better than the average pitching staff. That’s a win and a half.
Pitcher hitting does matter, as hard as it is to predict. The Dodgers are building upon last season’s hitting success by adding Dan Haren. Even if they can’t match last year’s performance, it seems likely that the pitching staff will add additional value with their bats.
—
Last Thursday, Daren Willman announced that he added a bunch of video clips to his excellent searchable PitchFX database. The search tools are really powerful, and helped in the preparation of this post. Here’s a list (and set of video clips) of triples hit by opposing pitchers, which is pretty entertaining.
—
This post uses the following statistics:
- wRC+: Weighted Runs Created Plus. Compares a player’s offensive output to the league average position player, and is neutralized for park and league. 100 wRC+ is an average offensive player, 110 wRC+ is 10% above average, etc. Explanation here.
- oWAR: Offensive wins above replacement, by Baseball Reference. This statistic measures a pitcher’s hitting level against replacement level pitcher hitting.
- wRAA: Weighted Runs Above Average. The offensive input into Fangraphs’ WAR, this statistic measures the offensive output of a player in runs. Explanation here.
 Dodgers Digest Los Angeles Dodgers Baseball Blog