Despite significant worries entering the season, Josh Beckett has been outstanding so far. After allowing one run in 6-1/3 innings on Tuesday, he has a 2.38 ERA in 41-1/3 innings. After his tricky surgery last year, the Dodgers have to be thrilled with the results. That shiny ERA isn’t without warning signs, though. I could make a post about how Beckett’s ERA-FIP gap is one of largest gaps among starters. I could make a post about his .226 BABIP, which will regress (though a very low 16.7% line drive rate doesn’t hurt). That stuff can get repetitive, though, so let’s focus elsewhere.
Last week, Pedro Moura posted a fantastic story on the increased usage of Beckett’s curveball. And on Brooks Baseball, you can see that Beckett is using the pitch more often this year than he has in the past. 30% of his pitches have been curves this season, which is tied for the second-highest frequency in baseball behind Jose Fernandez’ 37% rate.
Back in the early Pitch FX era (2007-2009) Beckett also threw a high percentage of curves, but it has never been the pitch he’s thrown most. So far this year, only 54% of Beckett’s pitches have been “hard,” compared to his previous minimum of 63%.
Per Moura’s article, the suggestion to throw the curveball more came from A.J. Ellis:
Of the data Ellis then presented, Beckett remembers most the unexpectedly low slugging percentages against his curveball for both left- and right-handed hitters. There was other information, too, all about his curve and its unhittability.
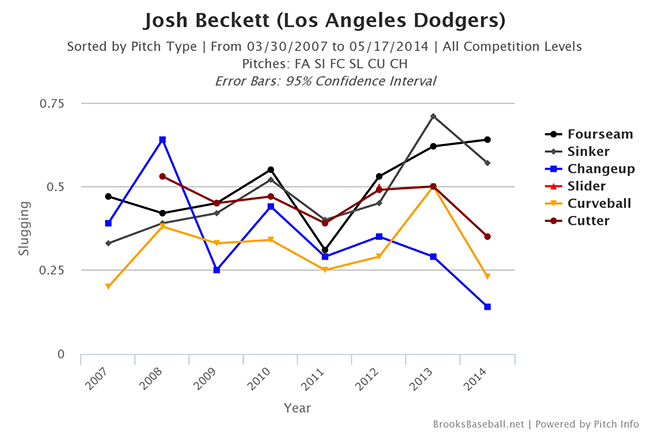
A.J. is the best, isn’t he? Here’s the slugging percentage against Beckett’s pitches throughout the Pitch FX era, which is probably similar to what Ellis presented to Beckett:
Other than last year’s injury-plagued season, A.J. definitely had a point. Beckett’s curve is typically near the lowest slugging allowed among all of his pitches. His change has also been extremely good this year, but let’s stay focused on the curve since Beckett is throwing it more often.
Throwing more curves is working, too. Per Fangraphs pitch values, Beckett’s curve is the fourth-most valuable in baseball. The pitchers he’s behind are familiar names: Fernandez, Sonny Gray, and Adam Wainwright.
Despite the low slugging through most years, the value of Beckett’s curve hasn’t always been this high. Per Fangraphs, last year’s curve value was nearly as negative as this year’s is positive. The pitch is the most valuable (on a rate basis) that it has been since Beckett’s 6.5 win season in 2007. Most other years have been in the approximate area of league-average.
This year’s results almost speak for themselves. 18 of Beckett’s 40 strikeouts have come on the curveball (5 called, 13 swinging). When he isn’t getting strikeouts on the pitch, batters aren’t doing much when they put it into play.
Despite the increase in usage and value, the pitch itself is pretty similar to what it has been in the past. The whiff rate is about the same. The horizontal break and vertical break are about the same. The two visible differences are both very minor. The first is that the pitch is 1.5mph slower this year than it was last year. When gravity is factored into the vertical break, the pitch dips about an inch more than it did previously.
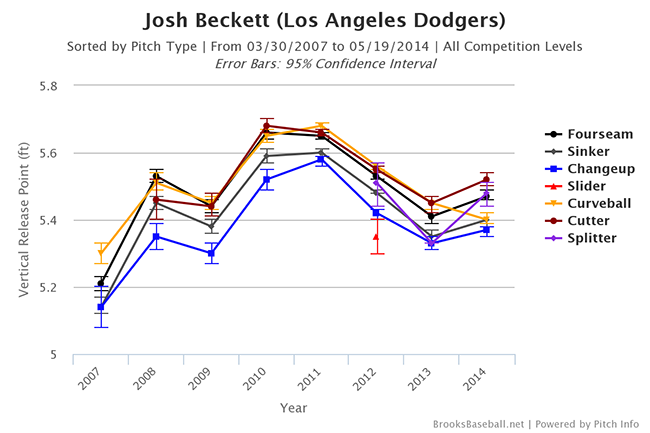
The other visible change is in his vertical release point:
In general, Beckett’s release point is higher this year, which is something to look for following his recovery from thoracic outlet syndrome surgery. However, the release point of his curveball is lower in relation to his other pitches than it has been in the past and is even lower than it was in 2013. This change might help “disguise” the pitch for longer and delay pitch recognition by hitters.
In addition to the strikeouts, Beckett is getting really good results when the curve is put into play. Batters are hitting just .113/.113/.226 against the pitch this year. The batted ball profile supports these results, too. Hitters have an 11% line drive rate against Beckett’s curve, which is seventh-best among pitchers who have thrown at least 100 curves this year. When hitters aren’t hitting Beckett’s curve on a line, they’re putting it on the ground. Beckett’s ground ball to fly ball ratio on curveballs put into play is 4.20:1.
What do those numbers actually mean? Here’s a quick comparison for context:
| Pitcher | LD% | GB/FB | Batting line |
|---|---|---|---|
| Beckett Curve, 2014 | 11% | 4.20 | .113/.113/.226 |
| Kershaw Curve, 2013 | 20% | 4.11 | .106/.106/.112 |
The comparison isn’t bullet-proof (Beckett has allowed four extra-base hits on his curve so far this year, Clayton Kershaw allowed one all of last year), but it also isn’t that far off, particularly in the GB/FB ratio.
Given the expectations we had going into the season, the fact that we can have a post like this in the middle of May is pretty amazing. I’m still worried about Beckett going forward, since some of peripherals have significant warning signs. However, since he’s throwing his curve while ahead in the count, it’s not directly leading to his walk issues and should continue to be a positive offering going forward.
 Dodgers Digest Los Angeles Dodgers Baseball Blog

