 Dodgers Digest Los Angeles Dodgers Baseball Blog
So far this season, Dee Gordon has been one of the Dodgers’ biggest surprises. After concluding the series against the Marlins, he’s hitting .353/.387/.457 and leads all Dodgers position players with 1.4 fWAR.
While Gordon’s offense has been outstanding thus far, his .417 BABIP sticks out. This will surely regress with a bigger sample size. His speed can support a higher-than-average BABIP if he hits the ball hard, but higher-than-average probably means somewhere in the .330 range if everything goes right (his expected BABIP by one metric on May 1 was .316).
Once the BABIP regresses, there are a few things that Gordon can do to make sure his offense is still valuable. A low strikeout rate will ensure that his batting average will remain closer to his BABIP (a higher strikeout rate forces batting average lower given a constant BABIP). Dee’s strikeout rate is 16.1%, even after three strikeouts yesterday, so he’s doing a great job with this so far.
The other thing that Dee can do is get on base through other methods. When he gets on base, he can add additional value through his legs. Right now, this is the biggest weakness in Dee’s offensive game. After the conclusion of Sunday’s contest, Dee’s 2014 walk rate is 4.8%, his lowest mark since his debut in 2011.
This isn’t an issue now, of course, just a potential problem in the future once balls in play find more gloves. And while the bulk of Dee’s times on base will come from hits rather than walks, looking into Pitch F/X data* can help us to see how fixable Dee’s walk rate will be in the future if his current approach continues.
Here’s a graph of some plate discipline numbers:
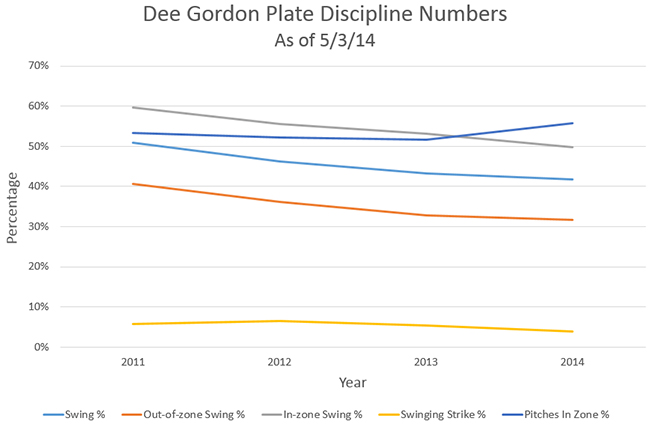
The following conclusions can be made based on the data above:
- • Dee is swinging at fewer pitches this year than he has in the past.
- • He is swinging at fewer pitches both inside and outside of the strike zone.
- • He is making contact more often when he does swing.
All of these statements would intuitively lead to more walks, not fewer. However, pitchers are throwing him more pitches in the strike zone (Pitches In Zone %) than ever before. So far this year, 55.8% of pitches to Dee have been located within the Pitch FX strike zone, compared to a career rate of 53.0% (a league-average hitter sees 48.6%).
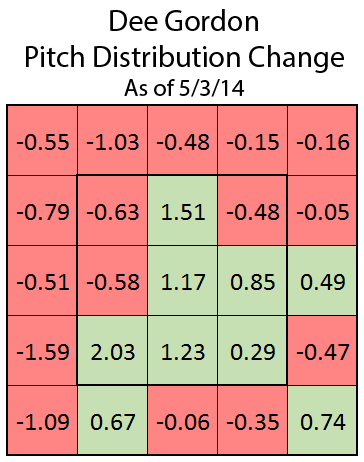
On the left is a breakdown of how pitchers are approaching Gordon so far this season. The numbers in each box are a change in percentage. Green (and positive) means that a pitcher is throwing in a particular box more often this year than they have in previous seasons. Red (and negative) means that a pitcher is throwing in the box less often. The plot is from the catcher’s perspective, so the left side of the plot is outside and the right side is inside.
The area with the biggest drop in percentage is the area outside and off the plate (left-most column of the chart). That area has seen 4.53% fewer pitches this season than it has in previous years. All other areas outside of the strike zone have gone down by a combined 0.86%. As expected, most of the strike zone is green, particularly the area right down the middle.
So, why are pitchers not throwing outside to Dee anymore? The reasoning might lie in Dee’s swing tendencies.
To explain the changes, I’ll start with a GIF:
This is the only pitch outside off the plate that Dee has swung and missed at all year. So far this season, Dee has swung at 24 of 103 pitches off the outside corner of the plate (23.3% swing rate). With only one whiff, that’s a 4.2% whiff/swing rate in this area. Between 2011 and 2013, Dee swung at 182 of 667 pitches thrown in the same area (27.3% swing rate). Of the 182 swings, he missed 35 times (19.2% whiff/swing rate). This significant reduction isn’t due to platooning – between 2011 and 2013 Dee had an 18.7% whiff/swing rate on outside pitches against right-handed pitching. In an ideal world, Dee wouldn’t swing at pitches off the plate. Even so, the fact that he’s doing something with the pitches other than missing could be forcing pitchers to adjust by throwing more pitches into the strike zone.
That’s a lot of numbers, and unfortunately it’s a bit of a challenge to say what they actually mean. It’s hard to sort out causes from effects. Gordon is swinging at fewer pitches than ever (which would lead to a higher walk rate), but making more contact when he does swing. He’s also closed a hole in his swing on outside pitches, and pitchers are throwing him more strikes. More strikes would lead to a lower walk rate, but not to the degree that it has shrunk so far.
Overall, I’m very cautiously optimistic. There are signs that Dee’s walk rate might be artificially low, and doing something with outside pitches (as opposed to missing) can lead to more positive results. Dee won’t keep hitting at the same rate that he is all season. But the walk rate should regress upwards and his floor might be just a little bit higher.
*All Pitch F/X data was taken following Saturday night’s game.