I suppose we have to move on from Kershaw’s game at some point, right?
Last week, Mitchel Lichtman and Dave Cameron both wrote articles on player statistical projection systems. These posts were inspired by Lichtman examining a database of mid-season Steamer projections. He examined the “rest of season” (RoS) predictions, which are adjusted slightly based on in-season numbers. He separated the players into two groups, “hot” players (who were significantly over-performing their projected numbers at a particular time point), and “cold” players (significantly under-performing their projected numbers).
Lichtman found that both the “hot” and “cold” players performed extremely close to their projected level for the rest of the year, no matter if the sample was looked at one month into the season or three months into the season. Basically, their numbers regressed towards the projected level (which takes previous seasons into account) as the year continued. The projections were close to “correct,” at least on average. The pre-season projections will adjust a bit as the “hot” or “cold” steaks extend later into the season, but the “rest of season” numbers remained accurate as a whole.
Before looking into hitting projections for the rest of the Dodger season, there are a few caveats worth mentioning. The data does not necessarily take platooning into account, so players like Andre Ethier, Carl Crawford, and Scott Van Slyke are likely a bit “under-projected” if their current usage trends continue. However, Dan Szymborski, creator of the ZiPS projection system, points out that the numbers will not move much even if platooning is given more weight.
Also, Lichtman’s findings do not necessarily mean that you shouldn’t look at a player and try to judge their performance for yourself. The take-away from the projection posts are that if you predict a break-out or break-down for every player who is breaking out or breaking down at this point of the year, you will be wrong more often than not. It doesn’t mean that you shouldn’t use your eyes and try to pick out exceptions, at least in my view. It’s just a way to say that the numbers lie sometimes and that regression to the mean is still a fundamental baseball concept.
Now, onto the numbers. Fangraphs updates the Steamer Rest of Season projections daily, and I’ve added ZiPS RoS projections to include additional information (these numbers were taken before Wednesday’s game). Below is a table with each Dodger offensive regular with over 100 plate appearances. On the left side of the table are each player’s weighted on base average (wOBA). Each player’s projected wOBA for the rest of the season from each section are included next to their current production. On the right side of the table is wRC+, which uses wOBA and adjusts for park and normalizes the numbers to league average (100 is average, 110 is 10% better than league average, etc).
I’ve also included the gap between each player’s actual performance and their projected levels for the rest of the season. Red means a player is performing better than his projection and is expected to decline. Green means a player is playing worse than his projection and is expected to improve:
| Player | 2014 wOBA | ZiPS RoS wOBA | Steamer RoS wOBA | 2014 wRC+ | ZiPS RoS wRC+ | Steamer RoS wRC+ |
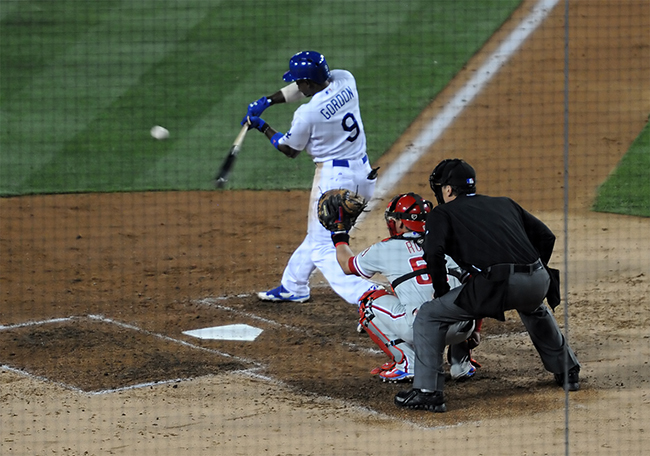
| Dee Gordon | .321 | .290 (-.031) | .288 (-.033) | 106 | 84 (-22) | 83 (-23) |
| Yasiel Puig | .417 | .379 (-.038) | .379 (-.038) | 172 | 146 (-26) | 146 (-26) |
| Andre Ethier | .307 | .322 (+.015) | .336 (+.029) | 97 | 107 (+10) | 116 (+19) |
| Matt Kemp | .343 | .348 (+.005) | .346 (+.003) | 121 | 124 (+3) | 123 (+2) |
| Carl Crawford | .304 | .313 (+.009) | .323 (+.019) | 95 | 100 (+5) | 107 (+12) |
| Scott Van Slyke | .425 | .342 (-.083) | .328 (-.097) | 177 | 121 (-56) | 111 (-66) |
| Hanley Ramirez | .359 | .359 (.000) | .352 (-.007) | 132 | 132 (0) | 127 (-5) |
| Adrian Gonzalez | .334 | .341 (+.007) | .357 (+.023) | 115 | 120 (+5) | 131 (+16) |
| Juan Uribe | .339 | .310 (-.029) | .300 (-.039) | 119 | 99 (-20) | 91 (-28) |
| Justin Turner | .336 | .312 (-.024) | .297 (-.039) | 116 | 100 (-16) | 89 (-27) |
| Drew Butera | .271 | .256 (-.015) | .240 (-.031) | 72 | 61 (-11) | 50 (-22) |
The player over-performing his projected rest of season numbers the most is Scott Van Slyke, which probably shouldn’t be a surprise. His past performance still carries significant amount of weight in the projections. Yasiel Puig, Juan Uribe, Justin Turner, and Dee Gordon are also overplaying their projections.
On the other end of the spectrum, there aren’t a lot of severely under-performing Dodgers, which comes as a bit of a surprise. Andre Ethier is the furthest below his projections, especially if you consider the impact of adding a bigger platoon factor. Adrian Gonzalez and Carl Crawford are a bit below their expected levels as well. Matt Kemp and Hanley Ramirez are both very close to their projections. There’s a little more red than green here, which is a bit concerning, but replacing Drew Butera with A.J. Ellis should help combat future regression.
This just covers the hitters. I will try to write a post on pitchers at a later date (probably next week). The lesson here is mostly that the numbers at this point in the season are still largely untrustworthy, so use them with caution. The projections are usually better.
 Dodgers Digest Los Angeles Dodgers Baseball Blog