 Dodgers Digest Los Angeles Dodgers Baseball Blog
In November, the Dodgers traded for the little-known Mike Bolsinger as part of a flurry of minor moves. We noted it as inconsequential, especially since the Dodgers acquired him for cash considerations. That Bolsinger started the brawl with Erisbel Arruebarrena last year was probably the most interesting thing about him. He’s almost 27, was never really a prospect, and has only pitched 52 innings in the majors.
The 40 man roster has been perpetually full since Bolsinger’s arrival, and he’s been on the fringe of it since he arrived. A Ryan Lavarnway/Kyle Jensen fate isn’t out of the question. Still, Bolsinger has survived the roster reconstruction thus far. The Dodgers are still short on starter depth, so it’s conceivable that he’ll make it to the regular season in the system somewhere. Let’s take a look at what Bolsinger did in the majors last season to see what we can learn.
On the surface, Bolsinger wasn’t great for the Diamondbacks last year. In nine starts and one relief appearance, he posted a 5.50 ERA (145 ERA-). By RA9-WAR, he was worth -0.6 wins. However, his peripherals were significantly better. A .355 BABIP and 64.2% strand rate really boosted his ERA. Bolsinger’s 4.01 FIP (105 FIP-) was a run and a half lower than his ERA, and just 5% worse than league average. By FIP, Bolsinger was worth +0.4 wins, a full win better than his RA9 value.
Since Bolsinger kept the ball on the ground (52.4% ground ball rate) and had a very high HR/FB ratio, his xFIP was outsanding; the 3.31 (90 xFIP-) was 10% better than league average. Taking the easy route and saying that Bolsinger was worse than his xFIP but better than his ERA could put him anywhere between a number three starter and sub-replacement-level AAA fodder. There’s a huge range of possibilities.
Looking at Bolsinger’s repertoire doesn’t really help:
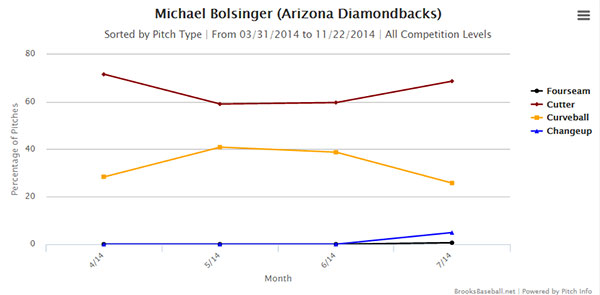
He only has two pitches. His cutter sits in the upper 80s, while the curve sits in the lower 80s. It’s a combination built for a reliever, and is somewhat similar to what J.P. Howell used from the Dodger bullpen last year (Howell uses a two-seamer in place of a cutter, but the usage rates and speeds are close).
Here are the pitches, visually:
Cutter:
Curve:
Neither look particularly special in action. Luckily, there’s also Pitch FX data to look at. Normally I like to break an analysis pitch-by-pitch, but since Bolsinger only has two, I’ll skip forward to his results as a whole.
Before comparing Bolsinger to the league, here’s a starting point:
| O-Swing* | O-Contact | Z-Swing | Z-Contact | Swing% | Contact% | Zone% | SwStr% | |
|---|---|---|---|---|---|---|---|---|
| Bolsinger Starting, 2014 | 32.0% | 56.5% | 55.2% | 91.5% | 44.3% | 79.7% | 53.1% | 8.7% |
| Brett Anderson, 2014 | 32.6% | 52.4% | 55.7% | 94.6% | 44.3% | 79.3% | 50.8% | 9.0% |
That’s fun. To an extent, when we analyze Bolsinger’s Pitch FX numbers, we’re analyzing Brett Anderson as well. Anderson has a longer track record, and there are some differences in out-of-zone and in-zone contact rates, but overall they were extremely similar last year. The front office probably didn’t do this on purpose, but it’s interesting.
So, how do Bolsinger’s numbers match up with the rest of the league? Below is a comparison, using standard deviations**, along with the league-average values for starting pitchers for each statistic.
| O-Swing | O-Contact | Z-Swing | Z-Contact | Swing% | Contact% | Zone% | SwStr% | |
|---|---|---|---|---|---|---|---|---|
| MLB Average Starter, 2014 | 29.8% | 64.5% | 62.7% | 88.4% | 45.9% | 80.5% | 48.9% | 8.8% |
| Bolsinger, Starting, 2014 | 32.0% | 56.5% | 55.2% | 91.5% | 44.3% | 79.7% | 53.1% | 8.7% |
| Standard Deviation | +0.72 | -1.31 | -2.79 | +1.17 | -0.66 | -0.22 | +1.30 | -0.06 |
What do these numbers actually mean? We’ll go from left to right. Bolsinger gets batters to swing at an above-average number of pitches outside of the zone. When batters swing at out-of-zone pitches, they miss more often than average. That’s good! The in-zone Pitch FX results were a bit more confusing. Last year, he limited swings on pitches inside the strike zone at a league-leading rate. However, when batters did swing, they make contact much more often than average.
Bolsinger also threw more pitches into the strike zone than an average starting pitcher. The high zone rate combined with the low in-zone swing rate partially explains Bolsinger’s above-average rate of looking strikeouts (37.5%, league rate was about 25%). A good framing catcher, like Miguel Montero in Arizona and now Yasmani Grandal in Los Angeles, will help him more than most provided that the results continue.
As a whole, batters swung slightly less often against Bolsinger than they did against an average starting pitcher, while making contact at a nearly average rate. Since there is more contact happening on in-zone pitches and less on out-of-zone pitches, batters are probably making better contact than average. Still, Z-contact and Z-contact:O-contact ratio are not correlated to ERA/FIP gap, so even that doesn’t solve the contact question completely.
Some of Bolsinger’s Pitch FX combinations seem strange, so it’s worth looking back to find some pitchers who did similar things. Since Pitch FX began tracking pitchers in 2007, there have been 1451 starting pitcher seasons of at least 50 innings (Bolsinger was two outs short of this mark last year, but it’s close enough for comparison’s sake). Below is a table showing the results of filtering these seasons, using a standard deviation range around Bolsinger’s numbers as a starter. For the individual results, I used +/- 0.5 standard deviations, but on some of the combinations I had to increase that to +/- 1 in order to produce a more usable results window. After filtering the pitchers, I calculated the group’s ERA- and FIP- (lower than 100 is better than league average), weighing by innings pitched.
Here are some of the results:
| Filter | SD | Number of pitchers | Group ERA- | Group FIP- |
|---|---|---|---|---|
| O-swing only | +/- 0.5 | 298 (20.5%) | 95 | 94 |
| O-contact only | +/- 0.5 | 223 (15.4%) | 91 | 90 |
| O-swing, O-contact | +/- 0.5 | 62 (4.3%) | 87 | 86 |
| Z-swing only | +/- 0.5 | 46 (3.2%) | 97 | 99 |
| Z-contact only | +/- 0.5 | 442 (30.5%) | 106 | 106 |
| Z-swing, Z-contact | +/- 1 | 75 (5.2%) | 99 | 99 |
| O-contact, Z-contact | +/- 0.5 | 30 (2.1%) | 97 | 96 |
| O-swing, Z-swing | +/- 1 | 42 (2.9%) | 87 | 87 |
| O-swing, O-contact, Z-swing, Z-contact | +/- 1 | 13 (0.9%) | 82 | 82 |
ERA- and FIP- results around 100 aren’t particularly meaningful, since the whole pool of pitchers is league-average. However, most of the comparable seasons are better than that.
Bolsinger’s out-of-zone stats generally led to favorable comparisons. Pitchers with similar out-of-zone swing rates were about 5% better than league-average, while pitchers with similar out-of-zone contact rates were about 10% better than league-average. Combining the two groups leaves 62 starting pitcher seasons, which combine for an ERA- of 87 and a FIP- of 86. To put these numbers into perspective, during the 2014 regular season, Madison Bumgarner had an 87 ERA- and 89 FIP-. Hyun-jin Ryu‘s outstanding and underrated career currently stands at 89 ERA- and 83 FIP-. Suddenly, Bolsinger’s 90 xFIP- doesn’t seem far from plausible.
However, Bolsinger’s in-zone stats led to more underwhelming comparisons. The in-zone contact matched a pool of pitchers a few percentage points worse than league average, closer to Bolsinger’s FIP. His in-zone swing rate pointed closer to league-average starters. When combined, the in-zone results pointed to an average pitcher, not particularly meaningful as described earlier.
When combining in-zone and out-of-zone contact rates, the comparable pitching seasons are only slightly better than league average. When combining in-zone and out-of-zone swing rates, however, the pool of 42 comparable pitching seasons are 13% better than league average, again in that Bumgarner/Ryu-ish territory.
Finally, when combining all four of the basic Pitch FX characteristics, it narrows the pool to 13 pitching seasons. By both FIP and ERA, the seasons combine to be 18% better than league-average. An 82 ERA- would have been the 23rd best in baseball among qualified starters last year. An 82 FIP- would have been 13th. By shrinking the sample, we’re also shrinking how predictive it is, but we still might be able to learn something from the type of pitchers who show up on the list:
| Season | Name | IP | ERA- | FIP- |
|---|---|---|---|---|
| 2009 | Adam Wainwright | 233 | 65 | 76 |
| 2011 | Alex Cobb | 52-2/3 | 88 | 94 |
| 2012 | Alex Cobb | 136-1/3 | 104 | 93 |
| 2013 | Alex Cobb | 143-1/3 | 73 | 89 |
| 2012 | Andy Pettitte | 75-1/3 | 68 | 82 |
| 2007 | Brandon Webb | 236-1/3 | 64 | 68 |
| 2008 | Brandon Webb | 226-2/3 | 73 | 72 |
| 2011 | C.J. Wilson | 233-1/3 | 68 | 76 |
| 2014 | Chris Capuano | 65-2/3 | 108 | 99 |
| 2013 | Dallas Keuchel | 132-1/3 | 123 | 102 |
| 2009 | John Lackey | 176-1/3 | 87 | 86 |
| 2010 | Marc Rzepczynski | 62-2/3 | 120 | 110 |
| 2007 | Tim Lincecum | 146-1/3 | 90 | 80 |
Had Bolsinger recorded two more outs as a starter, his ERA- would have been the worst on the above list by a lot, but his FIP- would have matched the upper end of the sample. There are a lot of really good pitchers here. There’s peak Brandon Webb, twice. There’s one season of peak Adam Wainwright. Andy Pettitte was pretty good in 2012. There are good seasons by Lackey and Wilson. Pre-breakout Lincecum is there, too. The worst season, by ERA-, was by Dallas Keuchel, who broke out a year later.
The name which pops up most often on the list is Alex Cobb, a very good major league starter. Like Bolsinger, he generates an above-average number of ground balls. His career 85 xFIP- is similar to Bolsinger’s 90. However, he reaches those results in a very different way. Cobb depends more on a splitter and sinker, which he throws much harder than Bolsinger’s cutter. This season, Cobb did not qualify for the list for the first time of his career. Batters swung at more of his in-zone pitches and missed more of his out-of-zone pitches. He’s a case study, but the style differences make it an unconvincing match.
Ultimately, the best comparison on the list might be the only pitcher without sustained success as a major league starter: Mark Rzepczynski, who moved to the bullpen a year after qualifying for this list. As a starter, he mixed in four pitches (now just two in the bullpen), so he’s not a perfect comparison. In terms of velocity, though, he was similar to Bolsinger, topping out around 90. He also had similar contact problems, too: an ERA higher than his FIP and a high HR/FB ratio. The good news is that after he moved to the bullpen he has remained useful, minus a disastrous 2012 campaign. He’s not as good as the rest of the list, but his presence isn’t a negative, either.
One difference between Bolsinger and most of the other pitchers on the list is that his zone rate is much higher. Only two of the thirteen pitchers were within +/- 1 standard deviation of Bolsinger’s zone rate: Wilson and Lackey. Again, the styles of those pitchers were very different from what Bolsinger was last season.
Bolsinger’s actual pitching results were mixed, and comparing his Pitch FX data to similar pitchers was encouraging (but thin). Turning to the projections doesn’t give much additional clarity. ZiPS projects Bolsinger as a starter, and doesn’t like him very much. A 4.22 ERA in 132-1/3 innings puts him just a bit above replacement level. That’s fine as a number five starter and potential innings eater depth, but there isn’t much optimism there. Steamer, on the other hand, projects Bolsinger as a reliever. The projected 3.16 ERA is third among current Dodger relievers, only behind Kenley Jansen and Joel Peralta. It would be a change of role for Bolsinger, but it seems like the more likely scenario if the Dodgers’ rotation stays healthy.
So, what’s to be drawn from all of this? Unfortunately, I don’t know. Bolsinger’s pitch mixture is so strange that it’s hard to know how he’ll fit in among the huge mixture of results and the positive Pitch FX comps. Will his contact problems, which didn’t exist in the minors and aren’t predictive in his major league sample size, continue? The Pitch FX comparison numbers will likely move around as well, and it’s easy to see batters adjusting to his pitching style by swinging at more in-zone pitches. Maybe Bolsinger can counter-adjust by throwing more pitches out of the zone, but his two pitches don’t have a lot of lateral movement. As a result, he might struggle to get batters to swing at pitches off the inner and outer edges of the plate. The change-up that popped up near the end of the season might be the solution to that problem, but it’s hard to know for sure.
Ultimately, Bolsinger is a puzzle. He’s not going to be a 90 ERA- type of starting pitcher, more than likely, even with the interesting comparisons. But, at the same time, there’s more to him than normal roster filler. A puzzle is more than what teams would normally expect to receive for cash considerations alone. The fact that he’s interesting enough to spend 2000 words on, for that price, means it was probably worth doing. It’s worth finding ways to retain him. It’s also at least enough to see what he can do as a starter for awhile longer, but his two pitch mix might ultimately relegate him to the bullpen.
—
*Pitch FX terminology – O-swing: out of zone swing rate; O-contact: out of zone contact rate; Z-swing: in zone swing rate; Z-contact: in zone contact rate
**Using standard deviation shows us where Bolsinger excels, where he’s bad, and where he’s ordinary. Assuming a normal (bell) distribution, a +0.5 standard deviation means that 19% of the sample is expected to be between him and the average. +1 standard deviation increases that number to 34%, and +2 brings it up to 47.7%. At that point, only 2.3% of the sample would be expected to be higher.