 Dodgers Digest Los Angeles Dodgers Baseball Blog
This post was co-written with long-time Dodgers Digest commenter, Maths Cat (@SpaceDodgers).
Joe Blanton is having an interesting season. In fact, he’s been having an interesting couple of seasons. After not appearing in a Major League game in 2014, Blanton was signed by the Royals in 2015, who converted him to a reliever before trading him to the Pirates in late July.
Blanton appeared in 15 games for the Royals (four starts, 11 relief appearances), where, in 41.2 IP, he recorded an ERA of 3.89 (3.59 FIP), struck out 40, walked seven, and allowed six home runs. He then had two excellent months for the Pirates, where he pitched 34.1 innings, recorded an ERA of 1.57 (2.11 FIP), struck out 39, walked nine, and allowed just one home run.
A big part of the the renaissance of Blanton is the fact that he’s developed a slider, and an effective one at that. Back when the Dodgers signed Blanton in January, our own Chad Moriyama wrote about that pitch, with visual examples. We’ll get back to that pitch — and Blanton’s pitch usage overall — in a bit. First, let’s look at the results Blanton’s gotten in his second Dodger stint.
Blanton has made 15 appearances in 2016 thus far, 13 of which have been scoreless. His ERA of 2.25 is outperforming his FIP of 3.59, though his xFIP of 3.92 indicates that we can expect an increase in those numbers. His ERA- of 57 (adjusted for park and league, where lower is better) shows he is 43 percent better than average, which is quite good; his FIP- (likewise) is 90, which is 10 percent above average.
To this point, Blanton’s strikeout and walk numbers are decent — he has struck out 26.8 percent of the batters he has faced while walking only 7.1 percent. Similarly, only 10.7 percent of the batters he’s faced successfully hit one of his pitches, resulting in a very low BABIP of .114, a number which you could expect to increase, unless his home run percentage becomes very large. Blanton has allowed runs twice this season, both times the result of home runs.
What has been truly bizarre are Blanton’s batted ball statistics. For his entire career, Blanton has induced grounders, on average, at a rate of around 44 percent, while giving up fly balls 35 percent of the time. Just over a month into the 2016 season, Blanton’s ground ball rate is 29.7 percent, while his fly ball rate is a staggering 54.1 percent.
These numbers can, and probably will, normalize a bit as the season goes on, but they’re still somewhat jarring. Why exactly, for the first time in his career, is Joe Blanton producing fly balls at such a high rate? Sure, pitchers sometimes have off months, and another month of data could change these statistics. But browsing Blanton’s career stats, it’s clear he’s never had anything like this happen before.
To answer this question, we need to look at what Joe Blanton is doing differently. A few things stand out: his arm slot is, overall, slightly lower than it was last year; he’s increased his slider usage and velocity (up 1.5 to 2 mph from last season); and he’s decreased his sinker usage.
We have the Royals and Pirates to thank for the changes in Blanton’s mechanics. Neil Weinberg’s piece on FanGraphs (referenced in Chad’s post from January) does an excellent job covering the mechanical and pitching changes that Blanton made in 2015. From that article:
Now it’s not exactly shocking that the Royals and Pirates had a hand in this given the Royals’ reputation with starter-to-reliever moves and Pirates’ employment of Ray Searage. If this were some nondescript starting pitcher who added 2 mph to his fastball, it would barely register because it’s become so commonplace. What is surprising is that Blanton didn’t take the normal path to reliever excellence. He was an 89-91 guy for his entire career and that’s exactly how hard he threw out of the pen.
Weinberg goes on to notice the substantial drop in Blanton’s arm slot, and explains that “lower arm-slot slider heavy pitchers are known for being tough on righties.”
That brings us to Blanton’s pitch usage:
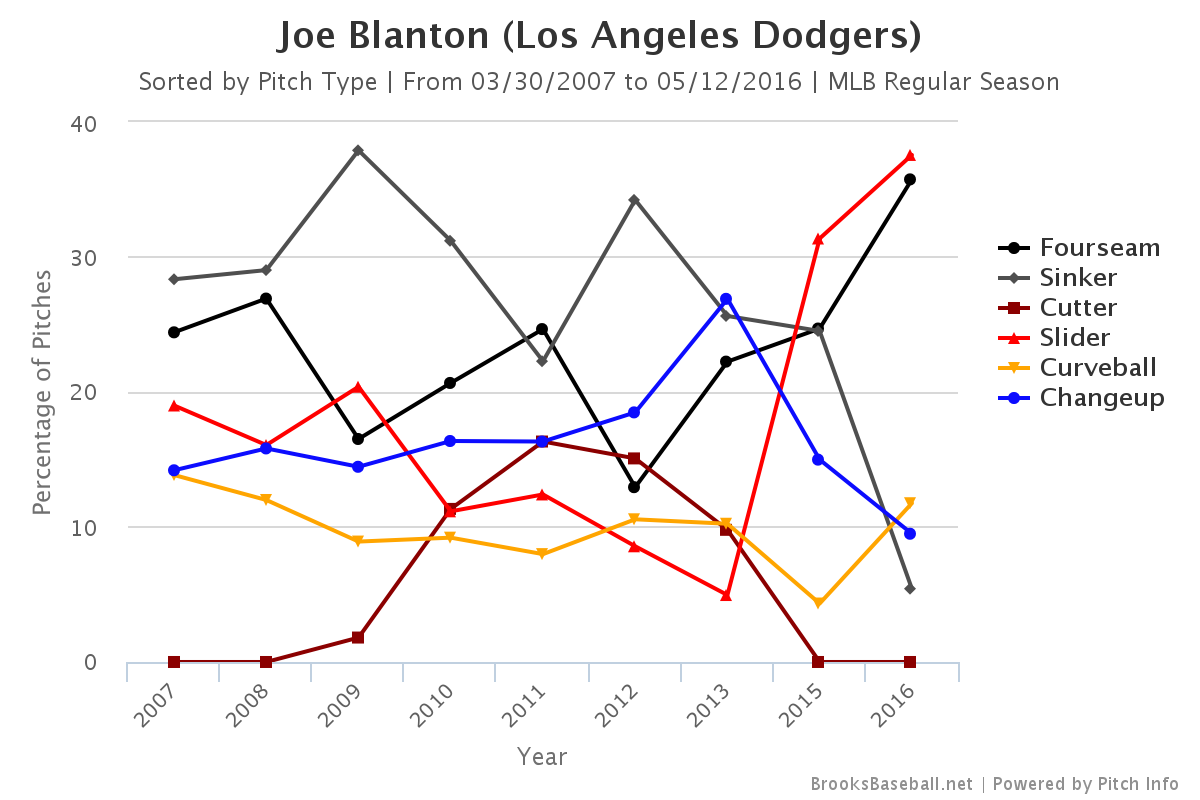
Here, we can clearly see that Blanton’s slider has come to dominate his repertoire. Furthermore, we can see the dramatic decline in frequency of his sinker.
A more nuanced story develops when we look at his splits:

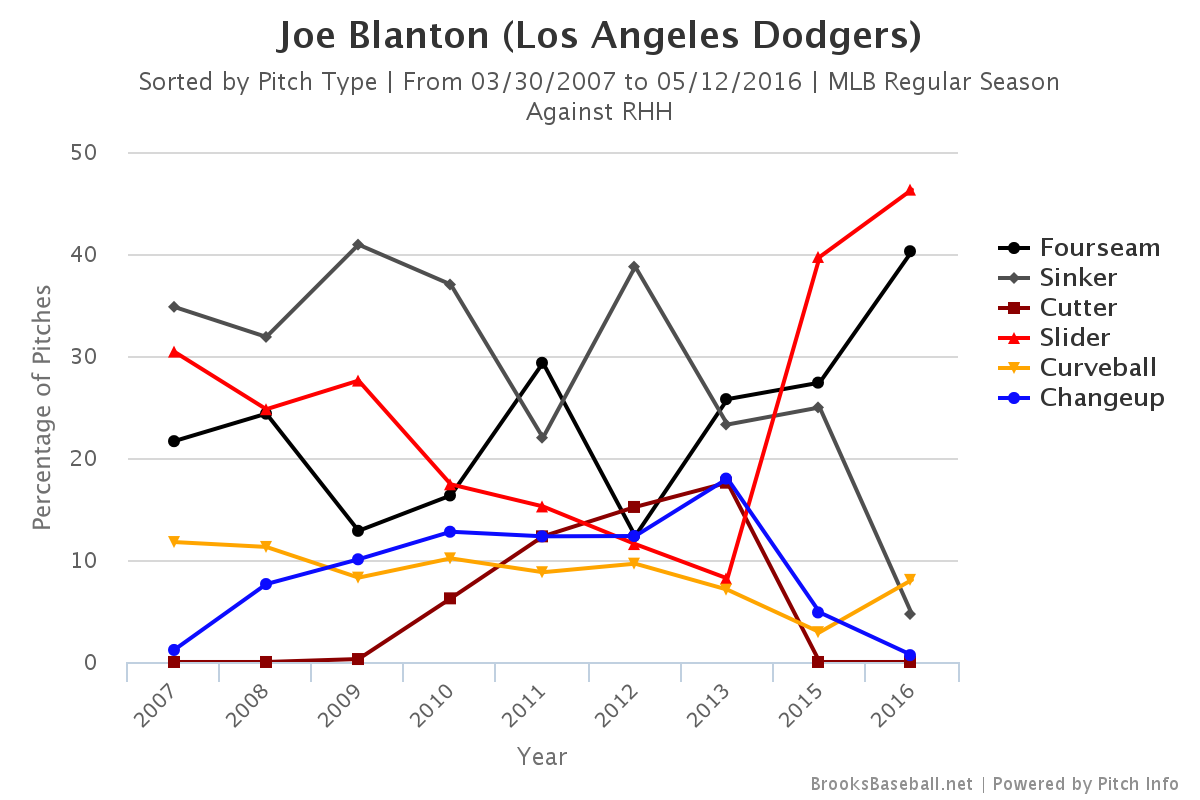
On the left, we have Blanton’s pitch usage vs. left-handed hitters, and his pitch usage vs. right-handed hitters on the right. This breakdown reveals that Blanton prefers his changeup over his slider when facing lefties, whereas the past two seasons, Blanton has come to depend on that slider vs. righties. His fourseam has become his second most used pitch.
Blanton’s sinker usage has drastically decreased. His sinker was tied for his second-most frequently used pitch last season, at 24.5 percent; this year, it’s his least-frequently used pitch — he only throws it about 6.9 percent of the time. The sinker was the pitch most likely to be hit, and usually for either a line drive (33.3 percent) or a ground ball (46.7 percent); its fly ball rate was around 13 percent.
The sinker is also the one pitch where Blanton’s arm slot has actually moved higher from last year. You can see this difference by looking at Blanton’s shoulder:

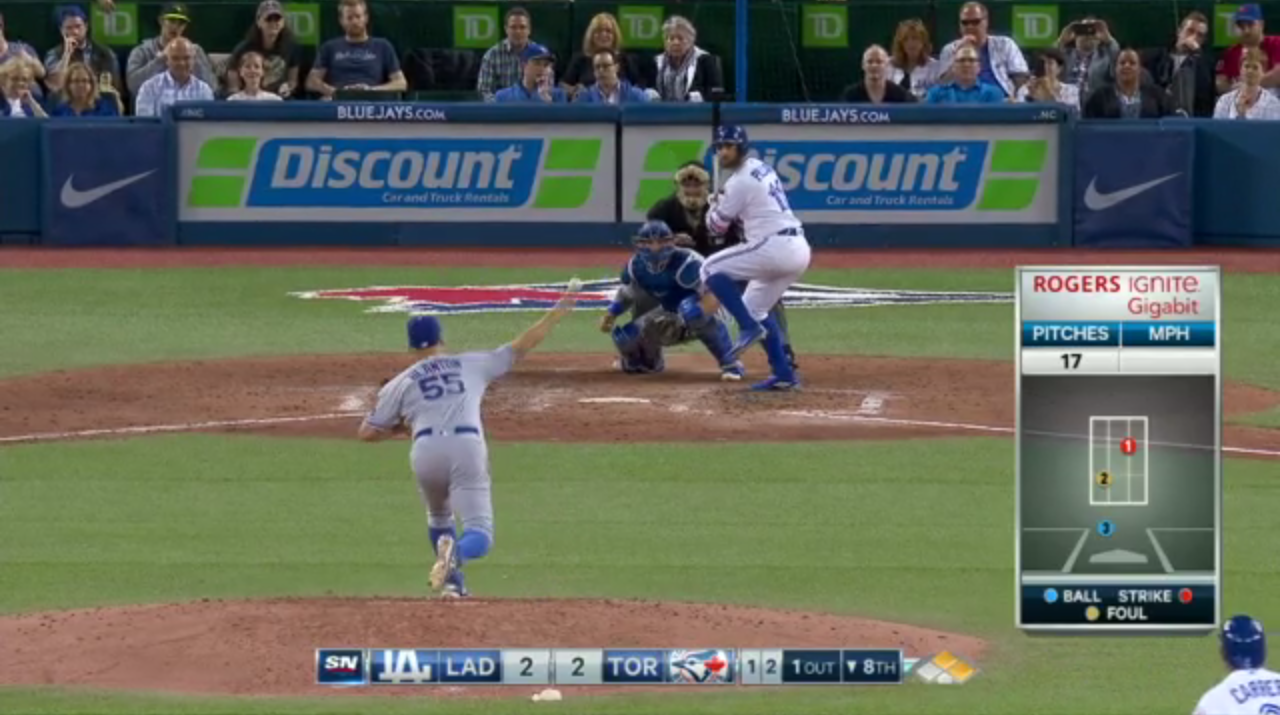
(Both of those pitches resulted in hits.)
Given his sinker’s hittability, paired with his apparent struggle to maintain that lower arm slot, it’s possible that Honeycutt & Co., are choosing to have Blanton drop the sinker in favor of increasing the frequency and speed of his slider. Dropping his sinker while increasing his slider’s usage and velocity adheres to the common starter-to-reliever formula Weinberg referenced, in which “a bad starter moves to the pen, drops one of his lesser pitches, and starts throwing harder” and finds success.
Since Blanton is relying so much more on his four-seamer, this helps to explain the increase in fly balls, as that pitch results in a much higher fly ball rate (35 percent last year). However, it does not explain why his changeup yields a 40 percent fly ball rate this season (compared to 7.4 percent last year), or why his slider has a fly ball rate of 18.2 percent (compared to 11 percent last year). Of the 12 sinkers he’s thrown, 60 percent have resulted in fly balls as well. (It’s worth noting that most of the fly balls have occurred against left-handed hitters.)
The disparity between Blanton’s ground ball and fly ball rates is certainly a curiosity, and a concerning one at that. It could be an anomaly that will eventually stabilize. But the changes Blanton has made suggest that he is now a very different pitcher than he has been for the majority of his career. And while so far, he’s been one of the more effective parts of the Dodger bullpen, the data we have now indicates that we should keep an eye on those batted ball rates — and there’s a good chance we should expect more home runs off of Blanton going forward.