 Dodgers Digest Los Angeles Dodgers Baseball Blog
Last week I wrote a piece journeying through Jimmy Nelson‘s 2019 pitch data, comparing it to the career high-water mark he set in 2017. The conclusion was this: Although Nelson’s 2019 results were awful (6.95 ERA, 1.909 WHIP), his poor performance was almost entirely attributable to poor command of the strike zone, originating from a nagging elbow injury. In fact, much of his “stuff” was better than ever in 2019, especially on the slider and curveball. Indeed, he gained over 250 RPM in slider spin rate and 200 RPM in curveball spin rate between 2017 and 2019. There’s more to stuff than spin but those were notable gains, leading to 6 additional inches of horizontal movement in the slider and 6 inches of vertical movement in the curve. This all came with dips in velocity, however, especially on the fastball.
As you may know, it’s now 2021. 2019 was two yeas ago and a lot can change in a pitcher’s arm in two years. Did his velocity continue to drop? Was he able to maintain the spin and movement gains in flashed in 2019? Up until Monday night, Nelson had only pitched in spring training games at stadiums without Statcast equipment so there was no public pitch tracking data. His performance at Dodger Stadium in the second game of the Freeway Series gave us our first look into what Nelson’s stuff looks like now. He threw just 19 precious pitches, but collectively those 19 pitches are rich with information.
——
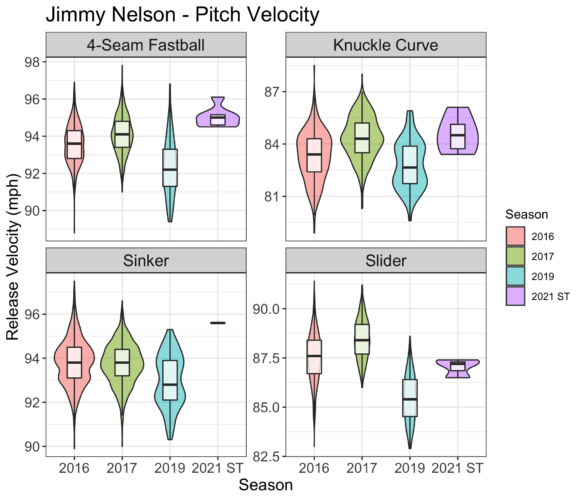
Let’s start with velocity. Good news! It’s up, or at the very least, back to pre-injury levels. Over his one inning pitched on Monday night, Nelson hit a maximum velocity of 96.1 MPH and didn’t throw a single fastball below 94.5 MPH. Over 175.1 innings pitched in 2017, he threw a grand total of 34 pitches 96 MPH or harder. His average fastball in 2017 was 94.1 MPH while it was 95 MPH on Monday. Yes, only 9 of the tracked pitches were fastballs and nine pitches in spring training is a microscopically small sample, but you can’t just luck into velocity. He might actually be throwing harder than he ever did. It remains to be seen whether Nelson can sustain throwing this hard throughout the season, but what he’s shown is encouraging. Below are a few density plots showing the relative distribution of pitch velocity.
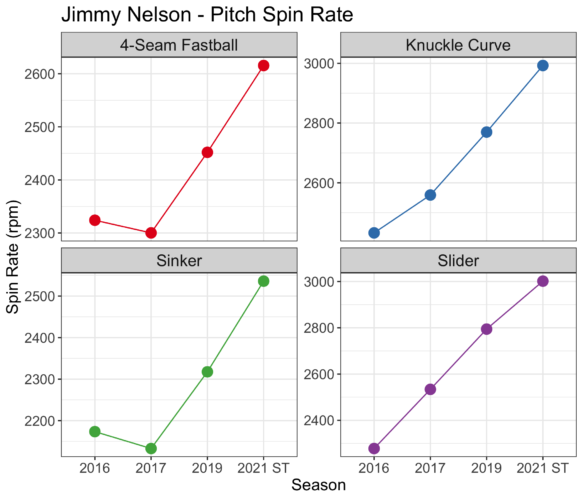
Next let’s examine spin rate. Spin imparts movement on pitches. This is a massive overgeneralization but broadly, the higher the rate of spin, the more movement. Nelson showed signs of appreciably increased spin rate across all of his pitches in 2019. But was he able to retain those gains? He didn’t just retain his spin rate increases, he doubled them. Yes. Doubled. Below I’ve plotted the average spin rate from all four of Nelson’s primary pitches across seasons and in his outing on Monday. His spin increases are basically a straight line across 2017, 2019 and his appearance in Monday’s spring training game. We already saw between 200 and 250 RPM increases on his slider and curve between 2017 and 2019. Over his career, those have been his two best pitches. In his appearance on Monday, he added another 250 RPM to both! His fastballs also saw large spin rate gains as well. You love to see it.
There’s much more to movement than spin rate and there’s more to pitching than movement but with the velocity and spin gains he’s shown, I expect that his pitches are now more lively than ever before.
Like I said, with only 19 pitches worth of tracked data from Jimmy Nelson, we can’t and shouldn’t make bold claims about what the 2021 season holds for him. However, what little data we do have is all, quite literally, pointing in the right direction. If he commands the strike zone like he did in 2017 and if he can stay healthy, Dodger fans might just see an incredible comeback story unfold in real time.