 Dodgers Digest Los Angeles Dodgers Baseball Blog
Clayton Kershaw has a 4.24 ERA in mid-May. This is obviously not something we have seen in a long time (other than last year, with many fewer innings), and worth looking at in more depth. However, it needs to be looked more than asking “What’s Wrong With Clayton Kershaw,” because it’s entirely possible that nothing’s wrong. Kershaw’s 31.1% strikeout rate is 0.8% worse than what he posted last year, and second only to Danny Salazar for the best in baseball. Kershaw’s 6.6% walk rate is higher than what he has posted in recent seasons, but is still close to where he was in 2012, when he almost won the Cy Young. His K%-BB% is 24.5%, which is fifth in baseball and would be the second-highest mark of Kershaw’s career.
Kershaw’s ERA- is 113, 13% worse than league-average. His FIP- is 71 (29% better than league-average, and halfway between his 2011 and 2012 seasons). Kershaw’s xFIP- is 57, which would be the second-best mark of his career and is basically identical to last season’s mark. The disparities are fairly easy to explain: Kershaw’s BABIP is high (.349, 8th-highest in MLB, and significantly higher than his previous career marks), and even higher with runners in scoring position (.471). Kershaw’s HR/FB rate is also high (18.5%, 11th-highest in baseball, and over double what he usually allows).
There are two causes for fluctuations in BABIP and HR/FB rate. One is “being hit hard,” and the other is “whatever, it’s just baseball.” BABIP and HR/FB ratio are two of the statistics which are least in the pitcher’s control, which is one reason why FIP and xFIP exist in the first place. This has already been covered specifically in relation to Kershaw, though – you can read Owen Watson on the subject at Just A Bit Outside here. Instead, it’s worth looking specifically at the statistical methods used to determine how hard a pitcher is being hit, which is one area where the public domain has lagged significantly behind MLB teams.
Information on how hard balls are hit started to pop up via ESPN’s Mark Simon last year. Hard Hit Rate is tracked by the video/scouting company Inside Edge. Employees watch video and classify batted balls as being “hard hit.” Some teams pay Inside Edge for this information. Up-to-date leaderboards are not available to the public, but occasionally Simon will tweet one out. On Monday, he posted this year’s best hard-hit rate for starting pitches:
Which MLB starting pitchers rank best in avoiding hard-hit contact? A few surprises in the top 40 Take a look pic.twitter.com/1JhDmloIwg
— Mark Simon (@MarkASimonSays) May 18, 2015
You’ll have to click on the image to enlarge the tweet, but according to Inside Edge, Kershaw has the seventh lowest hard-hit rate this season.
A very similar method also popped up this year on Fangraphs. Baseball Info Solutions gathers hard-hit data in a similar way to Inside Edge. As of this writing, Kershaw is 87th among 111 qualified starters in Hard%. That seems closer to the perception! The number would be the highest of Kershaw’s career, by a lot. It’s also very different than the Inside Edge data, which is confusing.
Since Fangraphs is providing these data going all the way back to 2002, we can get a better idea of how well Hard% correlates to BABIP and HR/FB rate. There have been 1101 pitchers to qualify for the ERA title in individual seasons between 2002 and 2014. Here is their Hard% against the two stats:
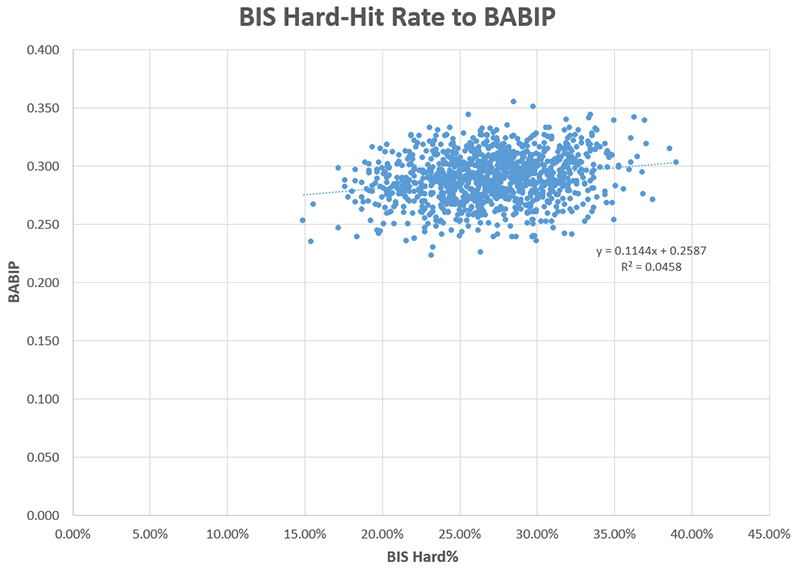
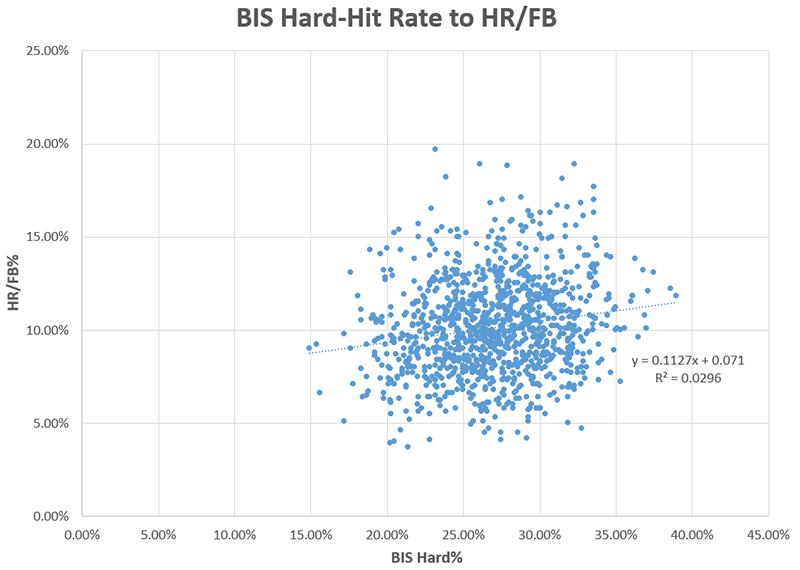
There’s a little bit of signal here, especially in the BABIP data, but not much. Even though Kershaw’s Hard% is up, it doesn’t necessarily mean that his BABIP and HR/FB rate will follow.
Finally, there is one last new toy that we have this year: StatCast. So far, there haven’t been a lot of public data from the system installed into every MLB park. However, one piece of data we are getting are the velocities of every batted ball hit this season. Teams have had this info via Hit FX for a long time, but this is the first time the public has been able to dig into it. Early returns are that it’s pretty important, via FiveThirtyEight’s Rob Arthur:
https://twitter.com/No_Little_Plans/status/600057653956636672
If the ball is hit harder, it’s more likely to result in a hit. Makes sense. These data are going to be a lot more predictive for hitters than pitchers at this point, much like any other batted ball statistic. Still, looking at average velocities so far can give us an idea of how well batters are connecting on Kershaw. So far this year, batters are averaging an exit velocity of 85.36mph against Kershaw. That’s the seventh-best value among MLB starters.
StatCast and Inside Edge are both in agreement that Clayton Kershaw has been really good at generating weak contact this year. Baseball Info Solutions, and perhaps perception, think that he has been awful at it. I’d be more willing to trust the StatCast numbers since they’re collected quantitatively, which means that I’m inclined to say that Kershaw doesn’t have a contact problem this year. He has just been really unlucky. It’s the boring explanation, but sometimes the answer isn’t interesting.
Either way, Kershaw’s long history of generating weak contact means way more than anything he could do in eight starts. Even if he was near the worst on the StatCast leaderboard (which he isn’t), this piece would be about the potential long stabilization times for pitcher batted ball velocities and how Kershaw was still getting his swinging strikes and strikeouts. He’ll be fine.